|
Field Filter |
Select
a table column from the drop-down menu to perform a search in: Alert
Name, Alert Text, Alert Class, Service, CI,
Closed Reason, Closed, CompId, Count, First Occ,
ID, Last Occ,
Owner, Primary Service, Sup, TicketGroup, TicketID.
Filters limit display
content and drop-down menu selections to only those items that pass through
the selected filter's criteria.
If no items match the filter,
you might have zero search
results (an empty table). |
|
Search Text |
Enter
the (case-sensitive) string to search for in the selected
Field Filter. |
|
CMDB Filter |
Enter the name of an Owner/Area/Group/Service/Environment
to include in the search. By default, all components of the CMDB (*)
are included in the search. |
|
Clear |
Clears
the Field Filter and Search Text entries. |
|
RegEx |
Toggles the Search Text field to accept
Regular Expressions for filtering. |
|
All |
Click
to show all alerts in the table: Open and Closed alerts. |
|
Open |
Click
to only show Open alerts in the table. |
|
Closed |
Click
to only show Closed alerts in the table. |
|
Owner Filter |
Select
the alert Owner to show alerts for in the table. |
| All |
Shows
alerts for all Owners in the table: Not
Owned and
Owned By Me alerts. |
| Not
Owned |
Shows
only alerts without Owners in the table. |
|
Owned By Me |
Shows
only alerts for the current user in the table. |
|
Alert Settings Conn OK |
Red |
The Alert
Server is disconnected. |
| Green |
The Alert Server
is connected. |
| |
| Total |
The
total number of Critical and Warning alerts currently in the table. |
| Critical
|
Check
to show alerts in the table that are currently in a critical state. Also
shows the
total number of alerts that are currently in a critical state and currently
listed in the table. NOTE: You must check Critical to see Critical
alerts in the table. |
| Warning |
Check
to show alerts in the table that are currently in a warning state. Also
shows the total number of alerts that are currently in a warning state and
currently listed in the table. NOTE: You must check Warning to see Warning
alerts in the table. |
| Suppressed |
Check
to show alerts in the table that are suppressed. NOTE: You must check Suppressed
to see Suppressed
alerts in the table. |
|
Own |
Click
to assign an Owner for the alert. This button is only visible to users with
Administrator privileges. |
|
Suppress |
Click
to suppress the alert. This button is only visible to users with
Administrator privileges. |
|
Close |
Click
to close the alert. This button is only visible to users with Administrator
privileges. |
| |
|
Alerts Table |
This
table lists all active alerts for the current filters. The table is empty
unless you check Critical, Warning, or both.
Filter the list using the search fields and drop-down menus (in the upper
portion of the display). To view details
about an alert, select an alert and click Alert Details (in the bottom
right portion of the display) to open the Alert Details dialog. To view
details about the CI source of the alert, select an alert and click Go To
CI (in the bottom right portion of the display) to open its Summary
display. |
|
First Occ |
The date and time
the alert first occurred. |
|
Last Occ |
The date and time
the alert last occurred. |
|
Count |
The number of times the
alert was generated. |
| Sup |
When checked,
the alert has been suppressed by a user. |
| Owner |
The named owner
assigned by the administrator. |
| Alert Name |
The name of the
alert. |
|
Primary Service |
The name of the
Service with which the alert is associated. |
| CI |
The CI alert source. |
| Alert Text |
Description
of the alert. |
|
AlertClass |
An optional alert field
which can be used when integrating with other alerting systems. |
|
CompID |
An optional alert field
which can be used when integrating with other alerting systems. |
|
TicketID |
An optional alert field
which can be used when integrating with other alerting systems. |
|
TicketGroup |
An optional alert field which can
be used when integrating with other alerting systems. |
| |
| Columns |
Id |
When checked,
shows the ID column in the table. |
|
Closed |
When checked,
shows the
Closed
column in the table. |
|
Closed Reason |
When checked,
shows the
Closed Reason
column in the table. |
| Go To CI |
Select an alert from the Alerts Table,
then click Go To CI to
view details for the selected CI in the Summary display. |
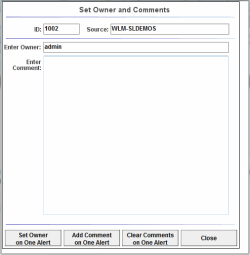
| Annotate |
Select one or more alerts from the Alerts Table,
then click Annotate
to open the Set
Owner and Comments dialog and enter
comments or change alert owner.
 |
|
ID |
Lists the alert IDs, separated by semicolons, for the alerts selected from the Alert Table. |
|
Source |
Lists the name of the back-end Data Server reporting the alert,
separated by semicolons. |
|
Enter Owner |
Enter the name of the owner for one or more
alerts, click
Set Owner of One Alert
to assign the Owner, then click Close. By default, this field displays
the current user name. |
|
Enter Comment |
Enter a comment for one or more alerts, click
Add Comment on One Alert
to apply the
Comment,
then click Close. By default, this field displays previously entered
comments. The text appears in the
Comments field
for the alert.
|
|
Set Owner |
Applies the name of the alert owner
in the Enter Owner
field for one or more alerts. |
|
Add Comment |
Applies the comment in the Enter
Comment field for one or more alerts. |
|
Clear Comments |
Removes all comments for one or more alerts. |
|
Close |
Closes the dialog. |
| Options |
Select an alert from the Alerts Table,
then click Options
to open the Alert Options dialog. This dialog
is provided for customizing your own alert options. |
|
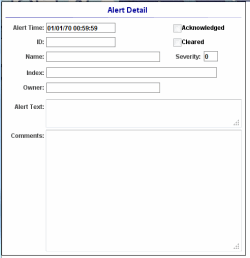
Details |
Select an alert from the Alerts Table,
then click this button to open the Alert Detail window and view alert
details.
 |
|
Alert Name Filter |
Enter
the (case-sensitive) string to search for.
Filters limit display
content and drop-down menu selections to only those items that pass through
the selected filter's criteria. If no items match the filter, you might have
zero search results as well as zero options available in
the drop-down menu(s). |
|
Clear |
Clears
entries in the Alert Name Filter
field and all table data. |
|
RegEx |
Toggles the Search Text field to accept
Regular Expressions for filtering. |
|
Sort by ID + Time |
When checked,
table rows are sorted by the Time and ID columns. |
| Time Range |
Select a time range or All Data from the
drop-down menu. By default, the ending period for displayed data is the
current time. To specify a time range: 1. Click the  button to open the calendar dialog. By default, the time range end point is
the current time.
2. Change the time range end point by
clicking the  button and selecting the date and time, then click OK. Or enter the
date and time in the text field using the following format: MMM dd, YYYY
HH:MM:ss. For example, Apr 26, 2012 5:01 PM.
3. Click Apply.
4. Use the navigation arrows  to move forward or backward one time period (the time period selected from
the Time Range
drop-down menu). Click Restore to Now to
reset the time range end point to the current time.
5. Click Apply and OK when
finished. |
| |
|
Alerts Table |
This
table lists all alerts for all Owners and all Areas that have
occurred in your EM system.
Filter the list by alert names using the
Alert Name Filter drop-down menu. |
| Time |
The date and time
the alert first occurred. |
| ID |
The unique string
identifier for the alert.
|
| Clear |
When checked,
the alert has been cleared by a user. |
| Sup |
When checked,
the alert has been suppressed by a user. |
| Owner |
The named owner
assigned by the administrator. |
| Alert Name |
The
name of the alert. |
| Alert Index |
Lists the
Alert Indices, separated
by tildes (~), for the alert. |
| Alert Text |
Descriptive text
about the alert. |
| Cleared Reason |
DATA UPDATE: The metric returned to normal thresholds.
MANUAL: A user cleared or closed the
alert manually. |
| Sev |
The severity level of the alert. |
| Source |
The name of the back-end Data Server reporting the alert. |

