Using the Platform - RTView Servers
These displays
enable you to monitor performance of all RTView
Servers.
RTView Servers displays are available when you install the RTVMGR Solution
Package. The RTVMGR Solution Package is provided with RTView EM.
Displays include:
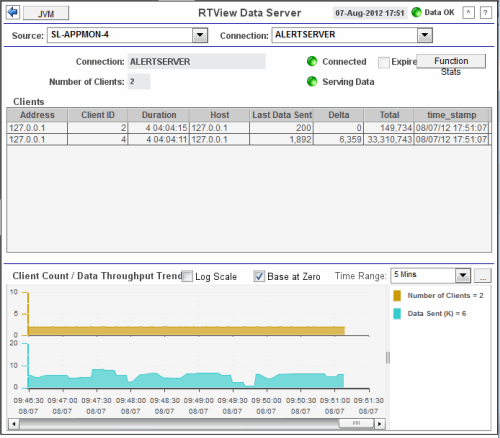
Data Servers
Track data transfer metrics
for RTView Data Servers, client count and throughput trends.

| JVM |
Click
to open the JVM CPU/Mem
Summary
display.
|
| Date, Time |
The
current data and time. When the time is incorrect, this might indicate that RTView
stopped running. |
| Data OK |
The data connection state. When the Date, Time
field displays the correct time and the Data OK indicator is green, this is a strong indication
that the RTView EM platform is receiving current and valid data. |
| Red |
The data source is disconnected (for example, if the Data Server is not
receiving data, or if the Display Server does not receive data from the Data
Server, this will be red). |
| |
| Green |
The data
source is connected.
|
| |
|
Source |
Select
the type of connection to the RTView Server. |
| Connection |
Select
an RTView Server from the drop-down menu. Names can be modified in
the RTView Server configuration properties file. |
| |
| Connection |
The connection
selected from the Connection drop-down
menu. |
| Number of
Clients |
The number of clients currently
server on this Data Server. |
| Connected |
| Red |
Data
Server is disconnected. |
| Green |
Data
Server is connected. |
| Serving Data |
| Red |
Data
Server is not currently serving data. |
| Green |
Data
Server is currently serving data. |
|
Expired |
This
server has been marked as expired after no activity. |
|
Function Stats |
Details about the performance statistics of RTView functions. |
| |
|
Clients |
This
table describes all clients on the selected server. |
|
Address |
The client IP address. |
|
Client ID |
The unique client identifier. |
|
Duration |
The
amount of time for this client session. Format:
dd HH:MM:SS
<days> <hours>:<minutes>:<seconds>
For example:
10d 08:41:38 |
|
Host |
The client host
name. |
|
Last Data Sent |
The
amount of data, in bytes, last sent to the client. |
|
Delta |
The
amount of data, in bytes, sent since the last update. |
|
Total |
The
total amount of data, in bytes, sent to the client. |
|
TIME_STAMP |
The
date and time
this row
of data was last updated. |
| |
|
Client Count / Data Throughput Trends |
Log Scale |
Enable to use a logarithmic scale for the Y
axis. Use Log Scale to see usage correlations for data with a wide
range of values. For example, if a minority of your data is on a scale of
tens, and a majority of your data is on a scale of thousands, the minority
of your data is typically not visible in non-log scale graphs. Log Scale makes data
on both scales visible by applying logarithmic values rather than actual
values to the data. |
| Base at Zero |
Use
zero as the Y axis minimum for all graph traces. |
| Time Range |
Select a time range or All Data from the
drop-down menu. By default, the ending period for displayed data is the
current time. To specify a time range: 1. Click the  button to open the calendar dialog. By default, the time range end point is
the current time.
2. Change the time range end point by
clicking the  button and selecting the date and time, then click OK. Or enter the
date and time in the text field using the following format: MMM dd, YYYY
HH:MM:ss. For example, Apr 26, 2012 5:01 PM.
3. Click Apply.
4. Use the navigation arrows  to move forward or backward one time period (the time period selected from
the Time Range
drop-down menu). Click Restore to Now to
reset the time range end point to the current time.
5. Click Apply and OK when
finished. |
|
Trend Graphs |
Shows
throughput metrics for all clients on the selected server. |
|
Number of Clients |
Traces the number
of clients
being
served by the Data Server. |
|
Data Sent |
Traces the total amount
of data, in Kilobytes, sent to all clients. |
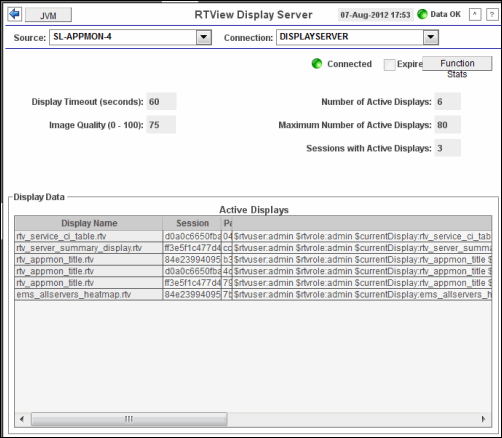
Display Servers
Track display utilization metrics
for RTView Display Servers.

| JVM |
Click
to open the JVM CPU/Mem
Summary
display.
|
| Date, Time |
The
current data and time. When the time is incorrect, this might indicate that RTView
stopped running. |
| Data OK |
The data connection state. When the Date, Time
field displays the correct time and the Data OK indicator is green, this is a strong indication
that the RTView EM platform is receiving current and valid data. |
| Red |
The data source is disconnected (for example, if the Data Server is not
receiving data, or if the Display Server does not receive data from the Data
Server, this will be red). |
| |
| Green |
The data
source is connected. |
| |
|
Source |
Select
the type of connection to the RTView Server. |
| Connection |
Select
an RTView Server from the drop-down menu. Names can be modified in
the RTView Server configuration properties file. |
| |
| Connected |
| Red |
Data
Server is disconnected. |
| Green |
Data
Server is connected. |
|
Expired |
This
server has been marked as expired after no activity. |
|
Function Stats |
Details about the performance statistics of RTView functions. |
| |
| Display Timeout
(seconds) |
The
amount of time, in seconds, that a display can be kept in memory after the
Display Servlet has stopped requesting it. The default is 60 seconds
(to allow faster load time when switching between displays). |
| Image Quality
(0-100) |
A
value between 0 and 100, which controls the quality of the generated images. If the value is
100, the Display Server outputs the highest quality image with the lowest
compression. If the value is 0, the Display Server outputs the lowest
quality image using the highest compression. The default is 75. |
| Number of
Active Displays |
The
total number of displays currently being viewed by a user. |
| Maximum Number
of Active Displays |
The maximum number of displays kept in memory. The default is 20 (to optimize memory used by the Display Server). |
|
Sessions with Active Displays |
Number
of clients accessing the Display Server. |
| |
|
Display Data / Active Displays |
Display Name |
The name of the
currently open display. |
|
Session |
A unique string identifier assigned to each session. |
|
Panel ID |
A unique string identifier assigned to each panel. The Display Server loads
each display requested by each client into a panel. This ID can be useful in
troubleshooting. |
|
Substitutions |
Lists the
substitutions used for the display. |
|
Last Ref |
The
amount of time that has elapsed since the display was last requested by a
client. |
| ID |
The client ID. |
|
Preloaded |
When checked,
indicates that the display (.rtv) file is configured in the DISPLAYSERVER.ini file to be preloaded. The history_config option
is used to configure display preloading. Preloading a display makes
data immediately available. Preloaded displays are not unloaded unless the
Display Server is restarted or the display cache is cleared via JMX. This
option can be used multiple times to specify multiple displays to preload. |
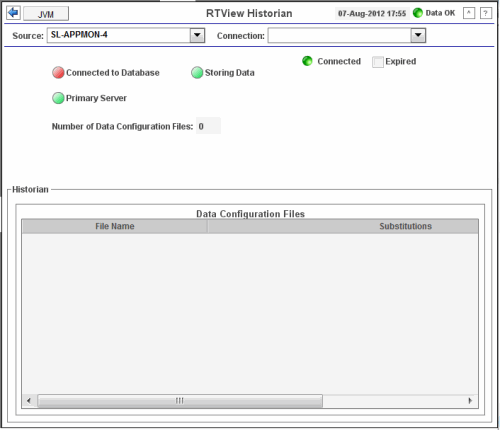
Historian Servers
Track the status of RTView
Historian Servers and data configuration file usage.
View the caches that are archived by the Historian
application, substitution variables associated with the history cache
configuration file, as well as the history cache status. You can also stop and
start the Historian, and purge data.

| JVM |
Click
to open the JVM CPU/Mem
Summary
display.
|
| Date, Time |
The
current data and time. When the time is incorrect, this might indicate that RTView
stopped running. |
| Data OK |
The data connection state. When the Date, Time
field displays the correct time and the Data OK indicator is green, this is a strong indication
that the RTView EM platform is receiving current and valid data. |
| Red |
The data source is disconnected (for example, if the Data Server is not
receiving data, or if the Display Server does not receive data from the Data
Server, this will be red). |
| |
| Green |
The data
source is connected. |
| |
|
Source |
Select
the type of connection to the RTView Server. |
| Connection |
Select
an RTView Server from the drop-down menu. Names can be modified in
the RTView Server configuration properties file. |
| |
| Connected |
| Red |
Historian Server is disconnected. |
| Green |
Historian Server is connected. |
|
Expired |
This
server has been marked as expired after no activity. |
| Connected
to Database |
| Red |
The
Historian Server is disconnected from the database. |
| Green |
The
Historian Server is connected to the database. |
| Primary Server
|
When green, indicates that this
Historian, when used within a group of Historians, is the primary group
member. If the primary member fails or shuts down, the standby member with
the highest priority becomes the primary group member.
When red, indicates that that this
Historian is a secondary server. |
| Red |
The
Historian Server
is a secondary
group member. |
| Green |
This
Historian
is the primary
group member. |
| Number of Data
Configuration Files |
The
number of configuration files that are used by the history cache. |
| |
|
Historian / Data Configuration Files |
File Name |
The name of the
history cache configuration file. |
|
Substitutions |
Lists the
substitutions specified in the history cache configuration file. |
|

