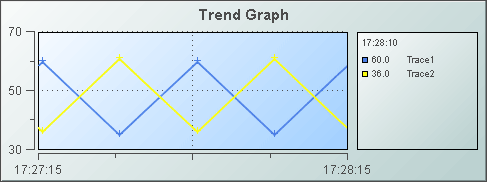
Trend Graph
Trend graphs (class
name: obj_trendgraph02) are useful for plotting a single value per
trace over time and for displaying historical data stored by the Historian. |
 |
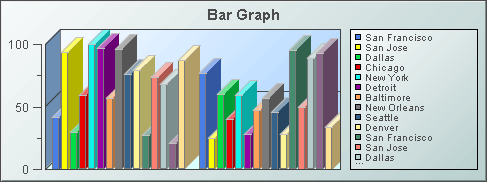
Bar Graph
Bar graphs (class name:
obj_bargraph) are useful for comparing columns or rows of numeric data
from a tabular data element returned by your data attachment. |
 |
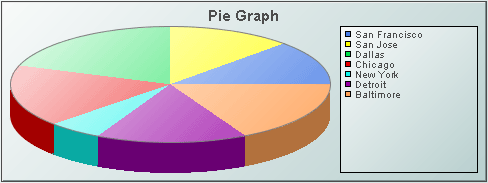
Pie Graph
Pie graphs (class name:
obj_pie) are useful for comparing values from a single column or a single
row of the tabular data element returned by your data attachment.
|
 |
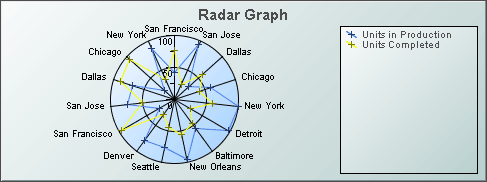
Radar
Graph
Radar graphs (class name:
obj_radar) are useful for comparing columns or rows of numeric data from
a tabular data element returned by your data attachment.
|
 |
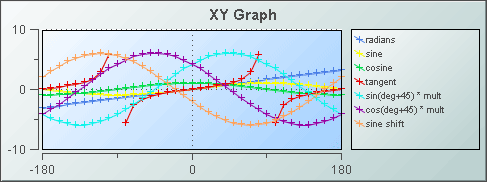
XY
Graph
XY graphs (class name: obj_xygraph)
are useful for comparing pairs of values from a tabular data element returned
by your data attachment. |
 |
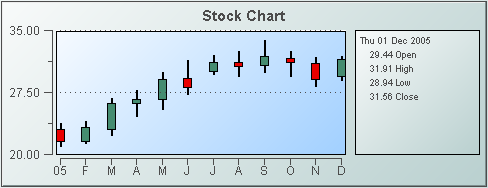
Stock Chart
Stock charts (class
name: obj_stockchart) are useful for displaying live and archived
stock data. |
 |
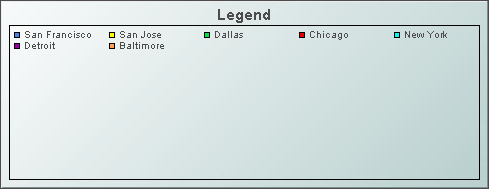
Legend
This object (class name: obj_legend)
is useful for displaying a legend that is too lengthy for the built-in
legends of the graph objects. The legend is easily resizable and can be used
in conjunction with any object on the Graphs tab, excluding the Heatmap, |
 |
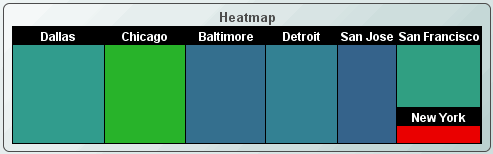
Heatmap
Heatmaps (class name:
obj_heatmap) display indexed hierarchical data as a set of nested rectangles. A
rectangle exists for each index and, when attached to data, each is filled with
smaller rectangles representing sub-indexes, known as nodes.
|
 |
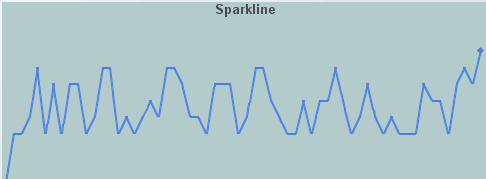
Sparkline
Sparkline graphs (class
name: obj_sparkline) are generally used to present trends and variations
in a simple and condensed way.
|
 |
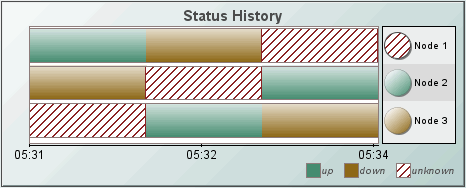
Status History
Status History charts (class name: obj_statushistory)
show discrete status values as horizontal bars drawn against a horizontal
time axis. A label appears at the right edge of each bar along with a
circular indicator displaying that bar's most recent status.
|
 |