Using the Platform - Single Area Service Views
In these displays, aggregated data
for alert states are organized by
Group
for
all
Services in a
single
Area,
while highlighting
the most critical alert states using
color. Data can be filtered by
Owner, Area, Group,
Environment and alert Metric.
Use these displays, for
example, to isolate the Area and Environment in which a critical alert is
occurring.
These displays drill-down to the
Service By CI Type
display.
The Single
Area Service Views displays
present data in tabular and heatmap formats.
-
Group / Service Heatmap:
Heatmap of alert states
for Services in a selected Area,
with
the option to filter by Group, Environment and alert Metric,
and show Service Names.
-
Region / Service Heatmap:
Heatmap as described for the Group / Service Heatmap (above), with
the option to filter by Region
and show Group Names.
-
Group / Service Table:
Table that shows alert states per Service across all CI Types,
with the option to filter by Group
and Environment.
-
Services CI Type Summary:
Table that shows the health state of Services per CI Type.
-
Services History Heatmap: Heatmap of alert states,
over time,
for Services in a selected Area,
with
the option to filter by Group, Environment and alert Metric.
Group / Service Heatmap
View
heatmap of alert states
for Services
in one Area, filtered by Group
and
Environment.
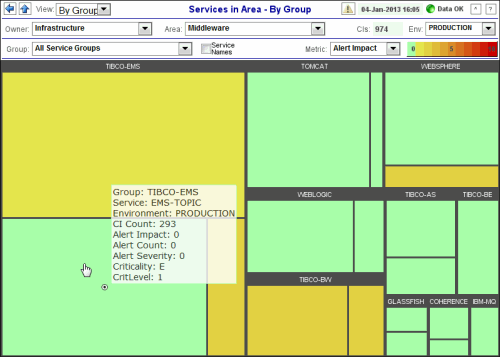
The heatmap
organizes Services
by Groups
in an Area.
Each rectangle in the heatmap represents a
Service, which is
arranged by Group.
The rectangle size represents the number of CIs in the
Service; a larger size is a larger value.
Each Metric (selected from the drop-down menu) has a color gradient bar
that maps relative values to colors. Move your mouse over a rectangle to
see additional information.
Use the drop-down menus to
filter data shown in the heatmap: a different Owner,
a different Area,
one or all Groups
or Environments, as
well as the alert Metric. By default, all Groups, all Environments and alert Impact are shown.
Drill-down and investigate by
clicking a
rectangle in the heatmap to view details in the Service By CI Type
display.
For details about display title bar functionality,
see Title Bar Functionality.
|
Owner |
Select
an
Owner to display in the heatmap. |
|
Area |
Select
an Area to display in the heatmap. |
| CIs |
The
total number of configuration items. This value is determined by the
selections made from display drop-down menus. |
| Group |
Select All
Service Groups
or a single Group to display in the heatmap. |
|
Service Names |
Toggle
to display service names in each heatmap rectangle. |
| Env |
Select All
or a single Environment to display in the heatmap. |
|
Metric |
Select
the metric to display in the heatmap. Each Metric has a color gradient bar
that maps relative values to colors. |
|
Alert
Impact |
The
highest
Alert
Impact value for any alert associated
with CIs in a given
rectangle. Values range
from 0 - 10, as indicated in the color gradient
 bar, where 10 is the highest
Alert
Impact. The
Alert
Impact
is calculated for each
CI, which is the
product of the CI
Criticality times the current maximum Alert Severity.
 |
|
Alert Severity |
The
maximum level of alerts in a given heatmap rectangle. Values range from 0
- 2, as indicated in the color gradient
 bar, where 2 is the highest
Alert Severity.
 |
| |
Metrics that
have exceeded their specified ALARM LEVEL threshold have an
Alert Severity value of 2. For a given
heatmap rectangle, this indicates that one or more metrics
have reached their
alert thresholds.
|
| |
| |
Metrics that
have exceeded their specified WARNING LEVEL threshold have an
Alert Severity value of 1. For a given
heatmap rectangle, this indicates that one or more metrics
have reached their warning thresholds. |
| |
| |
Metrics that have not exceeded either specified threshold have an
Alert Severity value of 0. For a given
heatmap rectangle, this indicates that no metrics
have reached their warning or alert
thresholds. |
| |
|
Alert Count |
The
total number of critical and warning alerts in a given heatmap rectangle.
The color gradient
 bar values range from
0 to the maximum count of alerts in the heatmap.
 |
|
Criticality |
The
maximum level of Criticality (rank of importance) in a given heatmap
rectangle. Values range from 1 to 5, as indicated in the color gradient
 bar, where 5 is the highest Criticality.
Criticality is specified in the
Service Data Model (CMDB) by your administrator. Criticality values are listed in the Component Views /
CI Service Table
display, which range from A to E, where A is the
highest Criticality (level 5 maps to a Criticality of
A and level 1
maps to a Criticality of E with equally spaced intermediate values). |
Region / Service Heatmap
View
heatmap of alert states
for Services
for a single Area,
filter
by Group,
Environment and
Region, and optionally show
Group Names.
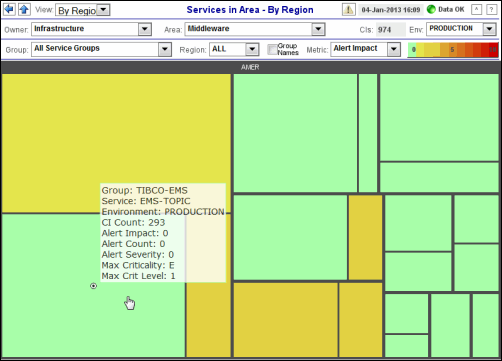
The heatmap
organizes Services
by one or more Groups
in an Area.
Each rectangle in the heatmap represents a
Service, which are
arranged by
Area and Group.
The rectangle size represents the number of CIs in the
Service; a larger size is a larger value.
Each Metric (selected from the drop-down menu) has a color gradient bar
that maps relative values to colors. Move your mouse over a rectangle to
see additional
information.
Use the drop-down menus to
filter data shown in the heatmap: a different Owner,
a different Area,
one or all Groups,
Regions or Environments, as
well as the alert Metric. By default, all Groups,
all Regions,
all Environments and
Alert Impact are shown.
Drill-down and investigate by
clicking a
rectangle in the heatmap to view details in
the Service By CI Type display.
For details about display title bar functionality,
see Title Bar Functionality.
|
Owner |
Select
an
Owner to display in the heatmap. |
|
Area |
Select
an Area to display in the heatmap. |
| CIs |
The
total number of configuration items. This value is determined by the
selections made from display drop-down menus. |
| Group |
Select All
Service Groups
or a single Group to display in the heatmap. |
|
Region |
Select All
Regions
or a single Region
to display in the heatmap. |
| Group Names |
Display the Group
names in each heatmap rectangle. |
| Env |
Select All
or a single Environment to display in the heatmap. |
|
Metric |
Select
the metric to display in the heatmap. Each Metric has a color gradient bar
that maps relative values to colors. |
|
Alert
Impact |
The
highest
Alert
Impact value for any alert associated
with CIs in a given
rectangle. Values range
from 0 - 10, as indicated in the color gradient
 bar, where 10 is the highest
Alert
Impact. The
Alert
Impact
is calculated for each
CI, which is the
product of the CI
Criticality times the current maximum Alert Severity.
|
|
Alert Severity |
The
maximum level of alerts in a given heatmap rectangle. Values range from 0
- 2, as indicated in the color gradient
 bar, where 2 is the highest
Alert Severity.
 |
| |
Metrics that
have exceeded their specified ALARM LEVEL threshold have an
Alert Severity value of 2. For a given
heatmap rectangle, this indicates that one or more metrics
have reached their
alert thresholds.
|
| |
| |
Metrics that
have exceeded their specified WARNING LEVEL threshold have an
Alert Severity value of 1. For a given
heatmap rectangle, this indicates that one or more metrics
have reached their warning thresholds. |
| |
| |
Metrics that have not exceeded either specified threshold have an
Alert Severity value of 0. For a given
heatmap rectangle, this indicates that no metrics
have reached their warning or alert
thresholds. |
| |
|
Alert Count |
The
total number of critical and warning alerts in a given heatmap rectangle.
The color gradient
 bar values range from
0 to the maximum count of alerts in the heatmap.
 |
|
Alert Criticality |
The
maximum level of Criticality (rank of importance) in a given heatmap
rectangle. Values range from 1 to 5, as indicated in the color gradient
 bar, where 5 is the highest Alert
Criticality.
Criticality is specified in the
Service Data Model (CMDB) by your administrator. Criticality values are listed in the Component Views /
CI Service Table
display, which range from A to E, where A is the
highest Criticality (level 5 maps to a Criticality of
A and level 1
maps to a Criticality of E with equally spaced intermediate values). |
Group / Service Table
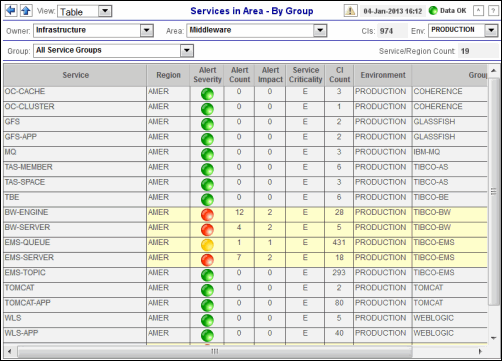
The table
lists all Services
and alert metrics (Impact,
Severity, Count and Criticality, and CI Count)
for a selected Area. Use this
display to check Service alerts by
Group
and Environment.
Each row in the table is a
different
Service.
The row color represents the
most critical
alert
state in each
Service.
| |
One
or more CIs associated with the Service
exceeded their critical threshold. |
| |
One
or more CIs
associated with the Service
exceeded
their warning threshold. |
Use the drop-down menus to
filter data shown in the table: a different Owner,
a different Area,
all Groups or a
single Group, all
Environments or a
single Environment. Use the
 sort button to
order column data. Drill-down and investigate by
clicking a
row in the table to view details in
the Service By CI Type display.
For details about display title bar functionality,
see Title Bar Functionality.
|
Owner |
Select an Owner to display in the table. |
|
Area |
Select an Area to display in the table. |
| CIs |
The
total number of configuration items. This value is determined by the
selections made from display drop-down menus. |
| Group |
Select All
Service Groups
or a single Group to display in the table. |
| Env |
Select All
or a single Environment to display in the table. |
|
Service/Region Count |
The
total number of Services listed in the table. This value is
determined by the selections made from display drop-down menus. |
| |
| Service
|
The name of the
Service
to which the alert applies. |
| Region
|
The name of the
Region
to which the Service applies. |
|
Alert Severity |
The
maximum level of alerts for the Service. Values range from 0 to
2, where 2 is the greatest
Alert Severity. |
| |
One
or more alerts exceeded their ALARM
LEVEL threshold for the Service. |
| |
One
or more alerts
exceeded their WARNING LEVEL threshold
for the Service. |
| |
No
alert thresholds have been exceeded for the Service. |
| Alert
Count |
The total number
of critical and warning alerts for the Service. |
| Alert
Impact |
The
product of the current maximum Alert Severity multiplied by the maximum
Criticality of all CIs for the Service.
Values range from 0 - 10, where 10 is the highest
Alert Impact.
|
| Service Criticality |
The
Criticality (rank of importance) specified in the Service Data Model (CMDB)
by your administrator.
Criticality values are listed in the Component Views /
CI Service Table
display, which range from A to E, where A is the
highest Criticality. This value is used to determine the value for
Alert Impact. |
| CI Count |
The
total number of configuration items associated with the Service. |
| Environment |
The name of the
Environment
to which the Service applies. |
| Group |
The name of the
Group to which the Service applies. |
Services CI Type Summary
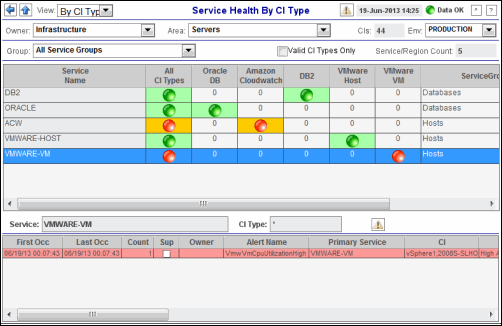
This table
lists
the health state of Services by CI Type. Each column is a CI Type and each row is a Service.
For each Service in a selected Group, a circular indicator
 shows the current maximum Alert Severity of all the CIs associated with
each CI Type:
| |
One
or more alerts
associated with the
CI Type
exceeded
their critical threshold. |
| |
One
or more alerts
associated with the
CI Type
exceeded
their warning threshold. |
| |
No alerts
associated with the
CI Type
have exceeded
their threshold. |
| |
There are no CIs associated with the CI
Type. |
The cell background color shows the current maximum Alert Impact of all
the CIs associated with the Service and CI Type.
The
Alert
Impact
is calculated for each
CI, which is the
product of the CI
Criticality times the current maximum Alert Severity. Background
colors range from green to red, green being the lowest possible alert impact and
red the highest possible value.
In the following figure is a list of Services
showing
the highest severity and alert impact for each CI Type. For example, the first
five Services in the list have an alert condition due to a BW Engine problem,
but additionally the INVENTORY MANAGER Service has a Tibco EMS Server problem.
The All CI Types column shows the global highest level for all
CI Types.

Use the drop-down menus to
filter data shown in the table: a different Owner, a different Area,
all Groups
or a single Group,
all
Environments or a single Environment. Select a row in the table to
view details in the lower table.
For details about display title bar functionality,
see Title Bar Functionality.
|
Owner |
Select an Owner to display in the table. |
|
Area |
Select an Area to display in the table. |
| CIs |
The
total number of configuration items. This value is determined by the
selections made from display drop-down menus. |
| Group |
Select All
Service Groups
or a single Group to display in the table. |
| Env |
Select All
or a single Environment to display in the table. |
|
Valid CI Types Only |
Check
to only show CI Type columns that contain data in the table, uncheck to
include columns that are empty. Including empty table columns can be helpful
when you are comparing Services (using the Group drop-down
menu) because the table columns retain their order. |
|
Service/Region Count |
The total number
of Services currently listed in the table. |
| |
| Service Name |
The name of the
Service. |
| All CI Types
|
The circular indicator
 shows the current maximum Alert Severity of all the CIs associated
with the CI Type, and the cell background color shows the
current maximum Alert Impact of all the CIs--across all CI Types--
associated with the Service.
 |
| |
| Alerts Table |
This table is lists the alerts associated with the
Service selected in the
upper table. Click a column in the upper table to filter data shown by CI
Type. For details about table column data, see
Alerts Table. |
|
Service |
The
Service that is currently
selected in the upper table. |
| CI
Type |
The
CI Type
that is currently selected in the upper table. |
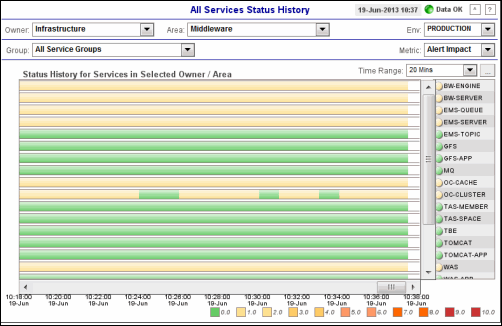
Services History Heatmap
View
history heatmap of alert states, over time,
for Services
in one Area, filtered by Group
and
Environment.
The
history
heatmap displays Services
from one or more Groups
and Environments of a given Owner and Area.
Each row in the heatmap represents a different
Service. The row color shows the Alert Impact or Alert Severity
of a
Service across time.
Mouse-over each row to see the time of alert state changes for particular
Service
occurred. For example, you can see at what time an alert state changed from
green to red. Each Metric (selected from the drop-down menu) has a color-coded
legend that maps relative values to colors.
Use the drop-down menus to
filter Services shown in the
history heatmap: a different Owner,
a different Area,
one or all Groups
or Environments, as
well as the alert Metric. By default, all Groups, all Environments and alert Impact are shown.
Drill-down and investigate by
clicking a
row in the history
heatmap to view details in the Service By CI Type
display.
For details about display title bar functionality,
see Title Bar Functionality.
|
Owner |
Select
an
Owner to display in the heatmap. |
|
Area |
Select
an Area to display in the heatmap. |
| Group |
Select All
Service Groups
or a single Group to display in the heatmap. |
| Env |
Select All
or a single Environment to display in the heatmap. |
|
Metric |
Select
the metric to display in the heatmap. Each Metric has a color gradient bar
that maps relative values to colors. |
|
Alert
Impact |
The
highest
Alert
Impact value for any alert associated
with CIs in a given
rectangle. Values range
from 0 - 10, as indicated in the color gradient
 bar, where 10 is the highest
Alert
Impact. The
Alert
Impact
is calculated for each
CI, which is the
product of the CI
Criticality times the current maximum Alert Severity.
 |
|
Alert Severity |
The
maximum level of alerts in a given heatmap rectangle. Values range from 0
- 2, as indicated in the color gradient
 bar, where 2 is the highest
Alert Severity.
 |
| |
|
Metrics that
have exceeded their specified ALARM LEVEL threshold have an
Alert Severity value of 2. For a given
heatmap rectangle, this indicates that one or more metrics
have reached their
alert thresholds.
|
| |
| |
Metrics that
have exceeded their specified WARNING LEVEL threshold have an
Alert Severity value of 1. For a given
heatmap rectangle, this indicates that one or more metrics
have reached their warning thresholds. |
| |
| |
Metrics that have not exceeded either specified threshold have an
Alert Severity value of 0. For a given
heatmap rectangle, this indicates that no metrics
have reached their warning or alert
thresholds. |
| |
|

