Using the Platform - Component Views
These displays present
the lowest level view of
CMDB
contents--the component level.
In these displays,
alert states for components are shown by Service and
Area
in tabular and heatmap formats,
while highlighting
the most critical alert state for each component. Data can be filtered by
Areas, Services,
Groups, Regions
and Environment.
Use
these displays to determine whether a component is malfunctioning.
-
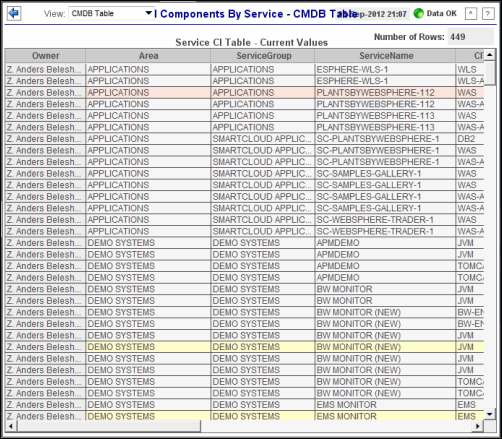
CI / Service Table:
Table of
CMDB contents for
all component-level details by
Service
for
all Owners,
Areas, Groups, Regions
and Environments (without the option to filter).
-
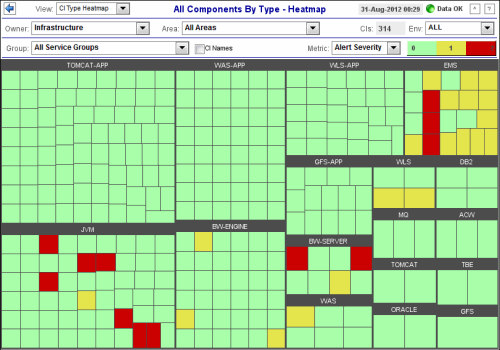
CI / Type Heatmap:
Heatmap of
CMDB contents organized by
CIType, with
the option to filter by Owner,
Area,
Group,
Environment and alert Metric,
and show CI Names.
-
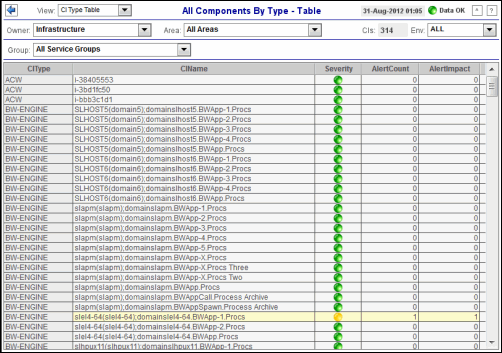
CI / Type Table:
Table of
CMDB contents for
all component-level details for
all
Areas, Services, Groups, Regions
and Environments, with
the option to filter by Owner
and one or all Areas,
Groups and Environments.
CI / Service Table
This table contains the
contents of the CMDB, listing
all CIs by
Owner, Area
and Group or
Service.
Each row in the able is a
different
CI (for example,
localhost;RTVMGR_DATASERVER).
The row color represents the
most critical
alert
state for the CI.
| |
One
or more alerts
exceeded their critical threshold for the
CI. |
| |
One
or more alerts
exceeded their warning threshold for the
CI. |
Use the drop-down menus to
filter data shown in the table: a different Owner,
one or all Areas, Groups or Environments.
Use the
 sort button to
order column data.

For details about display title bar functionality,
see Title Bar Functionality.
| Number of Rows |
The current total number of rows
in the table. |
| |
|
Owner |
The Owner
the CI is associated with. |
|
Area |
The
Area the CI is associated with. |
|
ServiceGroup |
The Group the CI is associated with. |
|
ServiceName |
The
Service the CI is associated with. |
|
CIType |
The
type of CI. |
|
CIName |
The
name or address of the CI. |
|
Severity |
The
maximum level of alerts for the
CI. Values range from 0 to
2, where 2 is the greatest
Alert Severity. |
| |
One
or more alerts exceeded their ALARM
LEVEL threshold for the CI. |
| |
One
or more alerts exceeded their WARNING
LEVEL threshold for the CI. |
| |
No
alert thresholds have been exceeded for the CI. |
|
AlertCount |
The total number
of critical and warning alerts for the CI. |
| OSType
|
The
operating system currently running on the CI. |
| Criticality |
The
Criticality (rank of importance) specified in the Service Data Model (CMDB)
by your administrator.
Criticality values are listed in the Component Views /
CI Service Table
display, which range from A to E, where A is the
highest Criticality. This value is used to determine the value for
Alert Impact. |
| Environment |
The Environment
for the CI. |
| City
|
The name of the
City for the CI. |
| Country
|
The name of the
Country for the CI. |
|
Region |
The name of the
Region for the CI. |
|
SiteName |
The name of the
Site for the CI. |
CI / Type Heatmap
View heatmap of alert states
for CIs
in all or one Area,
Group
or
Environment.
The heatmap
organizes
CIs
by
CI Type,
and uses color to show the most critical
alert
state
for each.
Each rectangle in the heatmap represents a
CI (for example,
localhost;RTVMGR_DATASERVER).
Each Metric (selected from the drop-down menu) has a color gradient bar
that maps relative values to colors. Move your mouse over a rectangle to
see additional
values.
Use the drop-down menus to
filter data shown in the heatmap: a different Owner,
a different Area,
one or all Groups
or Environments, as
well as the alert Metric. By default, all Areas.
Groups, and Environments and alert Impact are shown.
Optionally show CI Names.
Double-click (or right-click
and select Drill Down)
a
rectangle in the heatmap to view details relevant to
the CI Type.

For details about display title bar functionality,
see Title Bar Functionality.
|
Owner |
Select
an
Owner to display in the heatmap. |
|
Area |
Select
one or all
Areas to display in the heatmap. |
| CIs |
The
total number of configurable items. |
| Group |
Select
one or all
Groups to display in the heatmap. |
| Env |
Select
one or all Environments to display in the heatmap. |
| CI Names |
Display the CI
names in each heatmap rectangle. |
|
Metric |
Select
the metric to display in the heatmap. Each Metric has a color gradient bar
that maps relative values to colors. |
|
Alert
Impact |
The
product of the maximum Alert Severity multiplied by the maximum
Criticality of alerts in a given heatmap rectangle. Values range
from 0 - 10, as indicated in the color gradient
 bar, where 10 is the highest
Alert
Impact.
|
|
Alert Severity |
The
maximum level of alerts in a given heatmap rectangle. Values range from 0
- 2, as indicated in the color gradient
 bar, where 2 is the highest
Alert Severity.
 |
| |
Metrics that
have exceeded their specified ALARM LEVEL threshold have an
Alert Severity value of 2. For a given
heatmap rectangle, this indicates that one or more metrics
have reached their
alert thresholds.
|
| |
| |
Metrics that
have exceeded their specified WARNING LEVEL threshold have an
Alert Severity value of 1. For a given
heatmap rectangle, this indicates that one or more metrics
have reached their warning thresholds. |
| |
| |
Metrics that have not exceeded either specified threshold have an
Alert Severity value of 0. For a given
heatmap rectangle, this indicates that no metrics
have reached their warning or alert
thresholds. |
| |
|
Alert Count |
The
total number of critical and warning alerts in a given heatmap rectangle.
The color gradient
 bar values range from
0 to the maximum count of alerts in the heatmap. The middle value in the
gradient bar indicates the average alert count.
 |
|
Criticality |
The
maximum level of Criticality (rank of importance) in a given heatmap
rectangle. Values range from 1 to 5, as indicated in the color gradient
 bar, where 5 is the highest Criticality.
Criticality is specified in the
Service Data Model (CMDB) by your administrator. Criticality values are listed in the Component Views /
CI Service Table
display, which range from A to E, where A is the
highest Criticality (level 5 maps to a Criticality of
A and level 1
maps to a Criticality of E with equally spaced intermediate values). |
CI / Type Table
This table contains data
for the Component Views displays.
The table
lists all CIs by CIType and their
alert metrics (Impact,
Severity and Count)
for one or all Areas, Groups or Environments.
Each row in the able is a
different
CI (for example,
localhost;RTVMGR_DATASERVER).
The row color represents the
most critical
alert
state for the CI.
| |
One
or more alerts
exceeded their critical threshold. |
| |
One
or more alerts
exceeded their warning threshold. |
Use the drop-down menus to
filter data shown in the table: a different Owner,
one or all Areas, Groups or Environments.
Use the
 sort button to
order column data.

For details about display title bar functionality,
see Title Bar Functionality.
|
Owner |
Select an Owner to display in the table. |
|
Area |
Select
one or all Areas to display in the table. |
| CI Count |
The
total number of CIs listed in the table. This value is determined by the
selections made from display drop-down menus.
The totals number for each Environment are
also shown. |
| Group |
Select
one or all Groups to display in the table. |
| Env |
Select
one or all Environments to display in the table. |
| |
| CI
Table |
This
table lists all CIs for the selected Group. Each row in the table is a CI.
Each CI can have multiple alerts. Click a CI to view alerts for the CI in
the lower table. |
| CIType |
The type of CI. |
| CIName |
The
name or address of the CI. |
| Severity |
The
maximum level of alerts for the CI. Values range from 0 to
2, where 2 is the greatest
Alert Severity. |
| |
One
or more alerts exceeded their ALARM
LEVEL threshold for the CI. |
| |
One
or more alerts
exceeded their WARNING LEVEL threshold
for the CI. |
| |
No
alert thresholds have been exceeded for the CI. |
| Alert
Count |
The total number
of critical and warning alerts for the CI. |
| Alert
Impact |
The product of the maximum Alert Severity
multiplied by the maximum Criticality of alerts. Values range
from 0 - 10, where 10 is the highest
Alert
Impact. |
|

