Except where noted, all demos can be run in three ways, as an application, or via rich or thin client in a browser. If your RTView package features additional data sources, further Demos are located in the “RTView Data Sources” section.
Note: Some data sources do not have corresponding demos.
This section contains the following:
§ “Before You Begin” on page 1294
§ “Data Source Demo” on page 1295
§ “Self Service Alert Demo” on page 1296
§ “ElectroSphere Demo” on page 1307
§ “Features Demo” on page 1308
§ “Geothermal Demo” on page 1310
§ “Navigation Control Demo” on page 1311
§ “RTView Monitor” on page 1179
An Apache Tomcat application server is included with your RTView installation for prototyping and testing your deployment prior to deploying in the production environment. Several RTView demo applications are installed on the Demo Server as well. Once the Demo Server is started, you can access both rich and thin client demos.
The Demo Server runs on the HTTP/1.1 Connector port 8068. The shutdown port is 8069 and the AJP Connector port is 8070. The Demo Server also requires that you have JDK1.5.0_01+, and that your JAVA_HOME environment variable is set to the JDK installation directory.
In an initialized command window (see “Initializing a Command Prompt or Terminal Window”) type:
run_startup_demoserver
Stopping the Demo Server
In an initialized command window (see “Initializing a Command Prompt or Terminal Window”) type:
run_shutdown_demoserver
Initializing a Command Prompt or Terminal Window
Before running any RTView application from a Windows Command Prompt or UNIX terminal window, you must first initialize that window to set RTV_HOME and append RTV_HOME\bin to PATH. Alternatively, see “Setup” for information on how to set RTV_HOME and append RTV_HOME\bin to PATH globally.
Windows
To initialize a Command Prompt window, select Start-> Programs-> Accessories-> Command Prompt, go to your installation directory, and type:
rtv_init
UNIX
The script used to initialize a terminal window depends on whether you are in csh or bsh (e.g. Linux, Mac OS X).
csh
Open a terminal window, go to your installation directory, and type:
source rtv_init
bsh
Open a terminal window, go to your installation directory, and type:
. ./rtv_init.ksh
This demo illustrates how to use the RTView data source. Refer to the “RTView Data Sources” section of this documentation for further demonstrations specifically designed to illustrate your data source.
Note: You may not be licensed to run all RTView data sources.
1. Start the Simulators
Start the simulators for each data source you will be using. Refer to the “RTView Data Sources” section of this documentation for information on how to start a data simulation for your data source.
2. Run Demos - “Application Demo”, “Rich Client Browser Demo”, or “Thin Client Browser Demo”
1. In an initialized terminal window (see “Initializing a Command Prompt or Terminal Window”), go to the demos/dstutorial directory.
2. To view the demo, type:
run_viewer
3. To edit the demo, type:
run_builder
Start the Demo Server if it is not running. See “Starting the Demo Server”.
1. In an initialized command window (see “Initializing a Command Prompt or Terminal Window”), go to the demos/dstutorial directory and start the Data Server by typing:
run_dataserver -socket
2. Select the following in the Data Server dialog:
Start Serving Data
3. Open a browser and navigate to http://localhost:8068/dstutorial_applet.
Start the Demo Server if it is not running. See “Starting the Demo Server”.
1. In an initialized command window (see “Initializing a Command Prompt or Terminal Window”), go to the demos/dstutorial directory and start the Display Server by typing:
run_displayserver
2. Open a browser and navigate to http://localhost:8068/dstutorial.
The Self Service Alerts feature makes it easy to set and persist threshold, duration, and enabled settings for your alerts in a database. For details, see “Alerts”.
The Self Service Alerts demo is located in your RTView installation directory under demos\selfservicealerts. The demo can be modified and used stand-alone or integrated into your RTView application in order to view and administrate alerts. The demo contains some demo alerts and a pre-configured hsqldb database to store your alert settings. See “Modify the Stand-Alone Demo” and “Integrate the Demo into an RTView Application” for more information.
Note: For other database types, the demos\selfservicealerts\dbconfig directory contains .sql files with the correct table schemas and a README.txt that explains how to use them.
The demo contains three main displays (Alert Detail Table, Alert, Administration and Administration Audit). In the top right corner, each display shows the current time, a * button that opens the display in a new window and a ? button that opens Help. These objects are customizable and can be modified, removed, or replaced. See the “Customization Options” section for details.
1. In an initialized command/terminal window (see “Initializing a Command Prompt or Terminal Window”), navigate to the demos/selfservicealerts directory:
2. “Start the XML Data Simulator”
3. Start the hsqldb database by typing:
start run_hsqldb
4. Confirm that the demo server is running. If not, start it by typing: run_startup_demoserver.
5. You can view the demo in the Display Viewer or the Thin Client.
To view the demo in the Display Viewer, type the following:
run_viewer
To view the demo in the Thin Client, type the following, and then open a browser and navigate to http://localhost:8068/ssa/panels.html:
run_displayserver
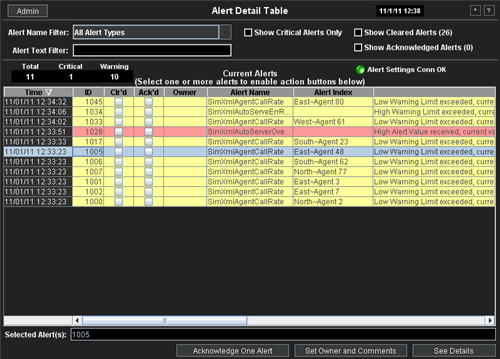
This display shows all of your current alerts:
|
Field Name |
Description |
|
Admin Button |
Click on this button to open the Alert Administration display in a new window. |
|
Alert Name Filter |
Select an alert name from the list to filter the table by the Alert Name column. |
|
Alert Text Filter |
Enter a value to filter the table by the Alert Text column. For example, a value of *High* will filter to rows where the alert text contains the word High. A value of High* will filter to rows where the alert text starts with High. |
|
Show Critical Alerts Only |
Only show alerts with a severity greater than 1. |
|
Show Cleared Alerts |
Show cleared alerts. The number following the Show Cleared Alerts label indicates the number of cleared alerts that match the selected Alert Name Filter and Show Critical Alerts Only values. |
|
Show Acknowledged Alerts |
Show Acknowledged alerts. The number following the Show Acknowledged Alerts label indicates the number of active (not-cleared) acknowledged alerts that match the selected Alert Name Filter and Show Critical Alerts Only values. |
|
Total |
Total number of alerts that match the filter criteria. |
|
Critical |
Number of alerts that match the filter criteria with a severity greater than 1. |
|
Warning |
Number of alerts that match the filter criteria with a severity of 1. |
|
Alert Settings ConnOK |
Indicates the connection status of the Alert Settings table. |
|
Current Alerts Table |
Displays all alerts that match the selected filters. § Red rows indicate the alert has a severity greater than 1. § Yellow rows indicate the alert has a severity of 1. Select one or more alerts from the table to enable the action buttons below the table. To select more than one alert: § Click on one alert, then hold the Shift key while clicking on another alert. All alerts in between will be selected. § Click on one alert, then hold the Control key while clicking on one or more other alerts. Only the alerts you click on will be selected. § Click on one alert, then hold the Shift key while pressing the up or down arrow on your keyboard. All alerts in between will be selected. § Click on one alert, then press Control+A to select all alerts in the table. |
|
Selected Alert(s) |
Lists ID of currently selected alerts. |
|
Acknowledge One Alert/Acknowledge Multiple Alerts |
Acknowledge the selected alert(s). If more than one alert is selected, you will be asked to confirm before the alerts are acknowledged. If only one alert is selected, it will be acknowledged without confirmation. |
|
Set Owner and Comments |
Click to open the Set Owner and Comments display. The ID field at the top of the display lists the IDs for all selected alerts. Any action will be applied to all alerts in that list. 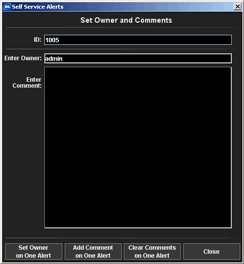
|
|
|
Set the Owner - The value of the Enter Owner field is filled in as the user name used when you logged in. If you are logged in with a role of admin or login is disabled, you can specify a different value for the owner. Click Set Owner on One Alert/Set Owner on Multiple Alerts to set the owner field for the selected alert(s) to the value specified in the Enter Owner field. Note: If more than one alert is selected, you will be asked to confirm before the owner is set on the alerts. If only one alert is selected, the owner will be set without confirmation. |
|
|
Add a Comment - Type a comment in the Enter Comment field, then click Add Comment to One Alert/Add Comment to Multiple Alerts to add the comment to the selected alert(s). The comment will be added to the alert(s) along with the timestamp and the user name from your login. Note: If more than one alert is selected, you will be asked to confirm before the comment is added to the alerts. If only one alert is selected, the comment will be added without confirmation. |
|
|
Clear All Comments - Click Clear Comments on One Alert/Clear Comments on Multiple Alerts to clear all comments from the selected alert(s). Note: If more than one alert is selected, you will be asked to confirm before the comments are cleared from the alerts. If only one alert is selected, the comments will be cleared without confirmation. |
|
Details |
Click to open the Alert Detail display to view details about the selected alert. Note: If more than one alert is selected, this display will show the details for the last alert in the selection list. See the “Customization Options” section for details on customizing this display. 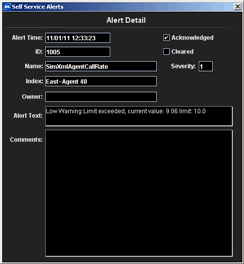
|
|
Options |
Click to open Options display showing options for the selected alert. Note: By default, the Options button in the Alert Details table display is hidden. See the “Customization Options” section for details on showing this button and customizing this display. |
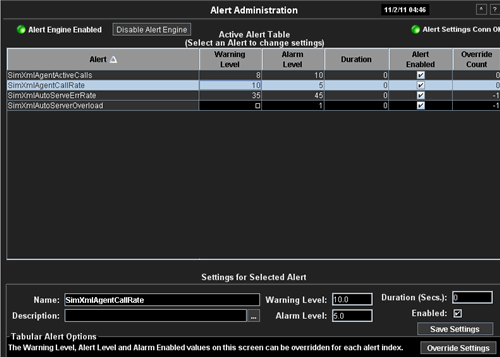
This display shows you the current values in the Alert Settings Table in the Self Service Alerts database.
|
Field Name |
Description |
|
Alert Engine Enabled/Disabled |
Indicates the status of the alert engine. If disabled, then click Enable Alert Engine to enable. If enabled, click Disable Alert Engine to disable. Note: The Enable and Disable Alert Engine buttons are only active if you are logged in with a role of admin or login is disabled. |
|
Alert Settings ConnOK |
Indicates the connection status of the Alert Settings Table. |
|
Active Alert Table |
Warning Level - Warning level threshold for the alert. If this value is NaN or a square, this means the alert doesn't support this threshold. |
|
|
Alarm Level - Alarm level threshold for the alert. If this value is NaN or a square, this means the alert doesn't support this threshold. |
|
|
Duration - Amount of time in seconds the value needs to meet the alert condition before an alert is generated. If the value is -1, this means the alert doesn't support duration. |
|
|
Alert Enabled - Enabled value for the alert. If an alert is disabled, no alerts of that type will be generated. |
|
|
Override Count - If this is a tabular Limits, Discrete or Multi state alert, the settings in this table can be overridden on a per-index basis. This column lists the number of indexes in that alert that override the settings in this table. A value of -1 indicates the alert doesn't support overriding the settings on a per-index basis. |
|
|
Active - Indicates whether the alert definition is loaded in the current instance of RTView. If false, then there is a row in the Alert Settings Table in the database for this alert, but the alert is not loaded in the system. This may indicate a problem with your configuration. By default, the Active column in the Alert Administration display is hidden. See the “Customization Options” section for details on showing this column. To configure RTView to remove alerts that are not loaded in the system on startup, select the Clean Alert Settings Table on Start option on the Self Service Alerts tab of the Application Options dialog or use the -cleansettingstable:true command line option. |
|
Settings for Selected Alert |
To modify an alert setting, select a row in the Active Alert table. Make changes to the Warning Level, Alarm Level, Duration, and Enabled fields, then click Save Settings. Note: The Save Settings button is only enabled if an alert is selected and the connection to the Alert Settings Table is OK and you are logged in with a role of admin or login is disabled. |
|
|
Name - Reflects value of alertName property. |
|
|
Description - If the description is longer than the field, click on the ellipsis (...) button to see the whole description. NOTE: Alert definitions may or may not contain a description. |
|
|
Enabled - If false, the selected alert will not be evaluated. |
|
|
Warning Level - Threshold that the value of the selected alert must cross in order to generate a severity 1 alert. |
|
|
Alarm Level - Threshold that the value of the selected alert must cross in order to generate a severity 2 alert. |
|
|
Duration (secs) - Amount of time that the selected alert must be in a Warning or Alarm state before an alert is generated. |
|
Tabular Alert Options |
If an alert is a tabular Limits, Discrete or Multi state alert, you can override the Warning Level, Alarm Level and Alert Enabled values specified on this screen. When you select an alert that supports this feature, an Override Settings button will appear at the bottom of the display. Click Override Settings to enter index-specific thresholds and enabled values. See Tabular Alert Administration section (below) for details. |
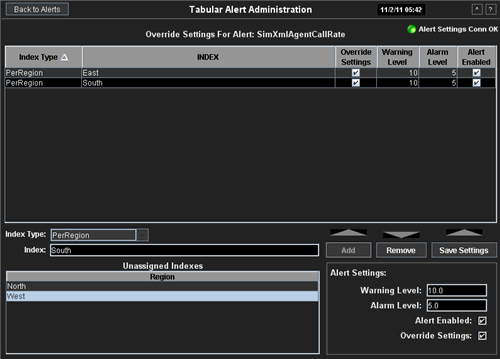
This display allows you to override the default warning, alarm and enabled settings on a per-index bases.
|
Field Name |
Description |
|
Back to Alerts |
Click to return to the main Alert Administration page. |
|
Alert Settings Conn OK |
Indicates the connection status of the Alert Settings Table. |
|
Override Settings Table |
Shows all of the per-index settings that you have saved. All indexes that are not overridden here will use the settings specified for this alert on the main Alert Administration page. |
|
|
Index Type - The index type of this setting. For alerts with no indexTypes defined, this will be All. Otherwise this will list the indexTypes defined for that alert. In the case of alerts with multiple index columns, the indexTypes allow you to set threshold and enabled values on a subset of index columns instead of specifying each index column in the index value. For example, if you have an alert that is indexed on Region and Agent, you can either set a threshold for a specific Region and Agent or you can set a threshold for all Agents in that Region. |
|
|
Index - Index value. |
|
|
Override Settings - If selected, use these settings for the specified index rather than the default settings specified on the main Alert Administration page. If not selected, this row of settings will be ignored. |
|
|
Warning Level - The warning level threshold for the alert index. If this value is NaN or a square, this means the alert doesn't support this threshold. |
|
|
Alarm Level - The alarm level threshold for the alert index. If this value is NaN or a square, this means the alert doesn't support this threshold. |
|
|
Alert Enabled - The enabled value for the alert index. If an alert index is disabled, no alerts for that index will be generated. |
|
The Add, Remove, and Save Settings buttons are only enabled if you have a valid selection, the connection to the Alert Settings Table is OK, and you are logged in with a role of admin or login is disabled. In addition, the Add button is disabled if the selected index is already defined. In that case Remove and Save Settings are enabled. If the selected index is not yet defined, the Add button is enabled and Remove and Save Settings are disabled. |
|
|
Add |
To add a new per-index setting, select an Index Type from the list and the table below will list all unassigned indexes available for that Index Type. Select an index from that list and fill in the Warning Level, Alarm Level, Alert Enabled, and Override Settings fields. Click Add to add to the Override Settings table. NOTE: If the Override Settings check box is not selected, these settings will be ignored and settings specified in the main Alert Administration page for this alert will be used. |
|
Remove |
To delete the settings for an index, select it from the table and click Remove. |
|
Save Settings |
To modify the settings for an index, select it from the table. Make changes and click Save Settings. |
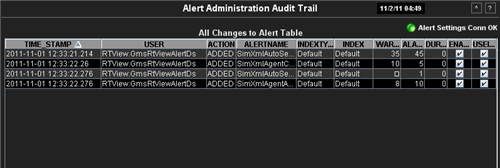
This display shows a history of alert administration actions executed in the Alert Administration and Tabular Alert Administration displays. The Self Service Audit Table contains the TIME_STAMP of the change, the USER that made the change, the ACTION that was done, plus row information.
|
Field Name |
Description |
|
Alert Settings ConnOK |
Indicates the connection status of the Alert Settings Table. |
|
TIME_STAMP |
Time the action was executed. |
|
USER |
User name from the RTView login or No Login if login was disabled. If the USER listed is RTView.GmsRtViewAlertDs, this indicates that RTView made the change. This happens when: § a row is added for a new alert, § when the threshold enabled flag for an alert that was already in the database changes, and § when a row is removed due to a selected Clean Settings Table On Startup option. |
|
ACTION |
Action taken. |
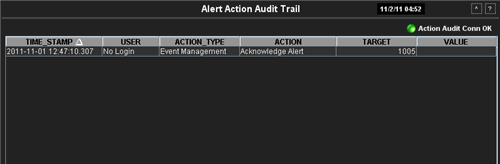
This display shows a history of alert actions executed in the Alert Detail display.
|
Field Name |
Description |
|
Action Audit ConnOK |
Indicates the connection status of the Self Service Audit Table. |
|
TIME_STAMP |
Time the action was executed. |
|
USER |
User name from the RTView login or No Login if login was disabled. |
|
ACTION TYPE |
Type of action taken. The ACTION TYPE depends on the command. |
|
ACTION |
Action taken. This will be the name of the command, with the exception of the Set Custom Alert Event Attribute command which will be Set <Attribute Name> (e.g. Set MyCustomAttrField). |
|
TARGET |
Target of the action. The TARGET depends on the command. |
|
VALUE |
The value of the action. The VALUE depends on the command. |
To use the Self Service Alerts demo to monitor your own alerts, you must first replace the demo alerts with your own. There are two ways to do this:
1. Save your alert definitions in a file named rtv_alertdefs.rtv, and replace the rtv_alertdefs.rtv in the selfservicealerts demo with yours.
OR
2. Save your alert definitions in one or more .rtv files in the demos/selfservicealerts directory.
1. “Start the Display Builder” from the selfservicealerts directory.
2. In the Display Builder, select Tools>Options.
3. In the Application Options dialog, select Alerts>“Alert Definitions Tab”, remove rtv_alertdefs.rtv, and add your own alert definition files.
4. Save and exit the Display Builder.
In either case, your alerts must be constructed as documented for self service alerts.
Replace Demo (hsqldb) Database
To use a different database to store your alert settings, modify the ALERTDB SQL Database Definition.
1. “Start the Display Builder” from the selfservicealerts directory.
2. In the Display Builder, select Tools>Options.
The Application Options dialog displays.
3. Select SQL in the Application Options dialog.
4. Edit the ALERTDB database connection to point to your database.
5. If necessary, change the Settings Table Name and Audit Table Name entries on the Alerts>“Self Service Alerts Tab” of the Application Options dialog.
6. Save and exit the Display Builder.
The dbconfig directory, located in the selfservicealerts directory, contains SQL schema files for several databases. You can use these files to create the necessary tables in your database. See the README.txt file in that directory for instructions.
Clear Demo (hsqldb) Database
You can also clear the included hsqldb database by running the DATA\reset_alerts script while the database is not running. This will remove all entries from the Alert Settings Table and the Self Service Audit Table.
Modify Alert Options
The Self Service Alerts demo is setup to limit the number of active alerts in the Alert Detail table to 2000, which removes cleared alerts every 5 minutes. If you anticipate a larger number of active alerts in the Alert Table at one time, you will need to increase this value. You can also adjust the rate at which cleared alerts are removed. Both of these options are available on the “Alerts Tab” of the Application Options dialog.
This demo is setup to use a Custom Alert Definition Property named DrillDownSuffix. You may add additional Custom Alert Definition Properties. See “Custom Alert Fields Tab” for more information.
The Self Service Alerts demo is set up to be easily customized in a few ways:
Modify the time label, new window button, and help buttons in the header
§ These objects are all contained in rtv_alerts_header_include.rtv. Edit this display to add or modify the objects displayed in the header of the displays.
Note: Do not add objects to the center or left top as they will be obscured by objects in the displays.
Use the $rtvAlertDataServer substitution
§ If you have deployed your alerts to a data server, specify the name of that data server for the $rtvAlertDataServer substitution on the General>Substitutions tab in the Application Options dialog.
Use the $rtvUserAlertOptionsEnabled substitution
§ By default, the Options button in the Alert Details table display is hidden. To make it visible, specify a value of 1 for the $rtvUserAlertOptionsEnabled substitution on the General>Substitutions tab in the Application Options dialog.
Override the Options display and do a per-alert-type override
§ Modify the user_alert_options.rtv file to add your own custom alert options. This is useful if you have added Custom Alert Event Attributes that you want your user to set. This file will be displayed when you click on Options in the Alert Detail Table for an alert that has no value for the DrillDownSuffix property in the alert definition. To create a different Options display for different alert definitions, specify a value for the DrillDownSuffix on the alert(s) where you don't want to use the default display. When Options is selected for an alert where the DrillDownSuffix is specified, it will open a file named user_alert_optionsDrillDownSuffix.rtv where DrillDownSuffix is the value you specified in the DrillDownSuffix property for that alert definition.
For example, let's say you have the following alert definitions:
MyAlert1 - This has no value for the DrillDownSuffix property. When you select an instance of MyAlert1 from the Alert Detail Table and click the Options button, it will open user_alert_options.rtv.
MyAlert2 - This has the value "_alert2" for the DrilldownSuffix property. When you select an instance of MyAlert2 from the Alert Detail Table and click the Options button, it will open user_alert_options_alert2.rtv.
MyAlert3 - This has the value "_alert3" for the DrilldownSuffix property. When you select an instance of MyAlert3 from the Alert Detail Table and click the Options button, it will open user_alert_options_alert3.rtv.
Override the Details display and do a per-alert-type override
§ Modify the user_alert_ details.rtv file to add your own custom alert details. This is useful if you've added Custom Alert Definition Properties or Custom Alert Event Attributes that you want to display. This file will be displayed when you click on Details in the Alert Detail Table for an alert that has no value for the DrillDownSuffix property in the alert definition. To create a different details display for different alert definitions, specify a value for the DrillDownSuffix on the alert(s) where you don't want to use the default display. When Details is selected for an alert where the DrillDownSuffix is specified, it will open a file named user_alert_detailsDrillDownSuffix.rtv where DrillDownSuffix is the value you specified in the DrillDownSuffix property for that alert definition.
For example, let's say you have the following alert definitions:
MyAlert1 - This has no value for the DrillDownSuffix property. When you select an instance of MyAlert1 from the Alert Detail Table and click the Details button, it will open user_alert_details.rtv.
MyAlert2 - This has the value "_alert2" for the DrilldownSuffix property. When you select an instance of MyAlert2 from the Alert Detail Table and click the Details button, it will open user_alert_details_alert2.rtv.
MyAlert3 - This has the value "_alert3" for the DrilldownSuffix property. When you select an instance of MyAlert3 from the Alert Detail Table and click the Details button, it will open user_alert_details_alert3.rtv.
Use the $rtvUserAlertActiveColumnEnabled substitution
§ By default, the Active column in the Alert Administration display is hidden. To make it visible, specify a value of 1 for the $rtvUserAlertActiveColumnEnabled substitution on the General>Substitutions tab of the Application Options dialog.
Help files
§ The help button (?) in the top left corner of the display is configured to display help files located in the docs directory of the demo. To modify this button to look for help files in another location, add a substitution named $displayHelpURL and set it to the url where you are hosting your help files.
§ To change the name of the help file for each display, modify ssa_displays.xml. This xml file has an entry for each .rtv file in the demo with the name of the corresponding html file to load. This file will be loaded from the url specified in $displayHelpURL.
Integrate the Demo into an RTView Application
Before integrating this demo into your RTView application, you must configure it as described above to monitor your alerts and store the settings in the database of your choice. See “Replace Demo Alerts” and “Replace Demo (hsqldb) Database” for more information.
Once you have done this, proceed with the following instructions:
1. Copy all of the .rtv files from the demos/selfservicealerts directory to your RTView application directory. If you will be using the built-in help files, also copy ssa_displays.xml and the selfservicealerts\docs directory to your RTView application directory.
2. Copy ALERTOPTIONS.ini and CACHEOPTIONS.ini files to the directory where you will be running the alerts. This might be your application directory, or it might be the directory where you are running the Data Server if you want the alerts to run in the Data Server.
Note: If this directory is not your application directory, move your alert configuration files (rtv_alertdefs.rtv and/or your other alert configuration files) and rt_alerts_cache.rtv to the same directory as ALERTOPTIONS.ini and CACHEOPTIONS.ini. Then, copy values from those files in the selfservicealerts directory into the corresponding OPTIONS.ini files in your application.
3. Add the ALERTDB option to the options file in the directory where you put the ALERTOPTIONS.ini and CACHEOPTIONS.ini:
Note: If the directory where you put ALERTOPTIONS.ini and CACHEOPTIONS.ini already contains an OPTIONS.ini file, then add the lines that start with sqldb ALERTDB and dbretry from demos/selfservicealerts/OPTIONS.ini file to that file.
Note: If the directory where you put ALERTOPTIONS.ini and CACHEOPTIONS.ini does not contain an OPTIONS.ini file, copy the OPTIONS.ini file from demos/selfservicealerts to there.
4. In your application directory, add the following display (.rtv) files to your panel configuration file:
rtv_alerts_table.rtv (Alert Detail View)
rtv_admin_alerts.rtv (Alert Administration)
rtv_alerts_audit.rtv (Administration Audit)
5. The Self Service Alerts demo uses the style sheets rtv_darkstyles.rts and rtv_flat.rtv to set the look and feel of the displays. If your application already uses these style sheets or if you do not want to apply a style sheet, you are finished.
a. If you want to apply the style sheets to your whole application:
In the Display Builder select Tools>Options. In the Application Options dialog, select General>Style Sheet. Click Add Built-in Styles and select rtv_darkstyles.rts and rtv_flat.rts. If you do not want these style sheets applied to the main Display Builder window, deselect Apply Style Sheets to Main Builder Window. Save your options and exit the Display Builder.
b. If you only want to apply the style sheets to the Self Service Alerts display files:
Open each of these files in the Display Builder and in each display, select Tools>Style Sheets. Click Add Built-in Styles and select rtv_darkstyles.rts and rtv_flat.rts. Click OK and Save each display.
6. If you will be deploying the Self Service Alerts in a thin client application and you will be using the built-in help files, include selfservicealerts\docs in the .war file for your thin client application. See the make_war.bat script, located in the selfservicealerts directory, as an example of how to include this in your war file.
The ElecroSphere demo, a Business Information Application, allows you to navigate through multiple types of business data.
Note: This demo requires use of the SQL data source and only runs on Windows with Microsoft Access. Your version of RTView may not be licensed to run the SQL data source.
1. Run Demos - “Application Demo”, “Rich Client Browser Demo”, or “Thin Client Browser Demo”
1. In an initialized terminal window (see “Initializing a Command Prompt or Terminal Window”), go to the demos/esphere directory.
2. To view the demo, type:
run_viewer
3. To edit the demo, type:
run_builder
Start the Demo Server if it is not running. See “Starting the Demo Server”.
1. In an initialized command window (see “Initializing a Command Prompt or Terminal Window”), go to the demos/esphere directory.
2. Start the Data Server by typing:
run_dataserver -socket
3. In the Data Server dialog, select:
Start Serving Data
4. Open a browser and navigate to http://localhost:8068/esphere_applet.
Start the Demo Server if it is not running. See “Starting the Demo Server”.
1. In an initialized command window (see “Initializing a Command Prompt or Terminal Window”), go to the demos/esphere directory.
2. Start the Display Server by typing:
run_displayserver
3. Open a browser and navigate to http://localhost:8068/esphere.
Presents an overview of the many features of RTView.
1. Run Demos - “Application Demo”, “Rich Client Browser Demo”, or “Thin Client Browser Demo”
1. In an initialized command window (see “Initializing a Command Prompt or Terminal Window”), go to the demos/features directory.
2. “Start the XML Data Simulator”
3. To view the demo, type:
run_viewer
4. To edit the demo, type:
run_builder
Start the Demo Server if it is not running. See “Starting the Demo Server”.
1. In an initialized command window (see “Initializing a Command Prompt or Terminal Window”), go to the demos/features directory.
2. “Start the XML Data Simulator”
3. Start the Data Server by typing:
run_dataserver -socket
4. In the Data Server dialog, select:
Start Serving Data
5. Open a browser and navigate to http://localhost:8068/features_applet.
Start the Demo Server if it is not running. See “Starting the Demo Server”.
1. In an initialized command window (see “Initializing a Command Prompt or Terminal Window”), go to the demos/features directory.
2. “Start the XML Data Simulator”
3. Start the Display Server by typing:
run_displayserver
4. Open a browser and navigate to http://localhost:8068/features.
Presents an overview of RTView Alert functionality.
1. Run Demos - “Application Demo”, “Rich Client Browser Demo”, or “Thin Client Browser Demo”
1. In an initialized command window (see “Initializing a Command Prompt or Terminal Window”), go to the demos/alertdemo directory.
2. “Start the XML Data Simulator”
3. To view the demo, type:
run_viewer
4. To edit the demo, type:
run_builder
Start the Demo Server if it is not running. See “Starting the Demo Server”.
1. In an initialized command window (see “Initializing a Command Prompt or Terminal Window”), go to the demos/alertdemo directory.
2. “Start the XML Data Simulator”
3. Start the Data Server by typing:
run_dataserver -socket
4. In the Data Server dialog, select:
Start Serving Data
5. Open a browser and navigate to http://localhost:8068/alertdemo_applet.
Start the Demo Server if it is not running. See “Starting the Demo Server”.
1. In an initialized command window (see “Initializing a Command Prompt or Terminal Window”), go to the demos/alertdemo directory.
2. “Start the XML Data Simulator”
3. Start the Display Server by typing:
run_displayserver
4. Open a browser and navigate to http://localhost:8068/alertdemo.
A real-time operational application that allows you to drill down to various levels of detail.
1. Run Demos - “Application Demo”, “Rich Client Browser Demo”, or “Thin Client Browser Demo”
1. In an initialized command window (see “Initializing a Command Prompt or Terminal Window”), go to the demos/geothermal directory.
2. “Start the XML Data Simulator”
3. To view the demo, type:
run_viewer
4. To edit the demo, type:
run_builder
Start the Demo Server if it is not running. See “Starting the Demo Server”.
1. In an initialized command window (see “Initializing a Command Prompt or Terminal Window”), go to the demos/geothermal directory.
2. “Start the XML Data Simulator”
3. Start the Data Server by typing:
run_dataserver -socket
4. In the Data Server dialog, select:
Start Serving Data
5. Open a browser and navigate to http://localhost:8068/geothermal_applet.
Start the Demo Server if it is not running. See “Starting the Demo Server”.
1. In an initialized command window (see “Initializing a Command Prompt or Terminal Window”), go to the demos/geothermal directory.
2. “Start the XML Data Simulator”
3. Start the Display Server by typing:
run_displayserver
4. Open a browser and navigate to http://localhost:8068/geothermal/panels.jsp.
Presents a multi-panel display in which a navigation control is used to navigate elements in a separate display. This demo allows you to view the tree control or the accordion control:
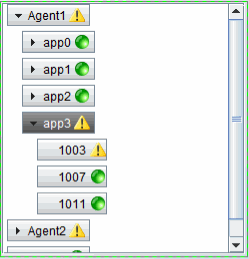
Note: The navigation control demo does not illustrate all of the control features. For example, the number of nodes does not change.
1. In an initialized command/terminal window (see “Initializing a Command Prompt or Terminal Window”), go to the demos\treecontrol directory.
2. “Start the XML Data Simulator”:
3. Start the Viewer by typing:
run_viewer to view the tree control demo.
run_viewer -panelconfig:PANELS_accordion.ini to view the accordion control demo.
4. To edit the demo, type:
run_builder