Using the Platform - Service Summary Views
These displays
present
alert states at the component-level
by Service in tabular and heatmap formats, while highlighting
the most critical alert state.
Data can be filtered by
Owner,
Area, Group, Service or Environment.
Use these displays to get
alert details and detailed status
information for a particular Service,
such as a list of all the CI Types relevant to a Service and the quality of the
performance metrics for each CI.
The
Service Summary Views displays
are:
-
Service By CI Type:
Table of
alert states for a Service
organized
CI Type,
with general alert information.
-
Service Summary:
Table of CIs by
Service,
with detailed alert information.
-
Service Health Heatmap:
Heatmap of
CIs by
Service, with
the
option to filter by Owner,
Area,
Group,
Environment
and alert Metric,
and show CI Names.
-
Service Browser:
Table of CIs by
Service with a
browser
format.
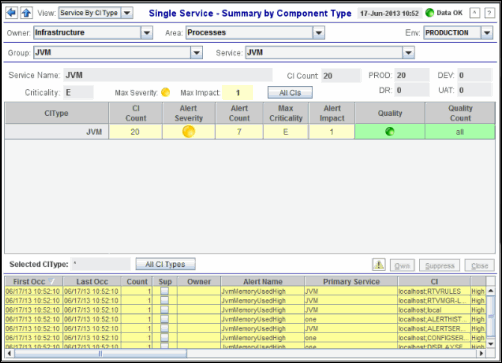
Service By CI Type
View
alert states for a
Service organized
CI Type. See the CI Count for a Service and obtain alert statistics for
CI Types such as Alert Severity and Alert Count.
Use this display to summarize
alerts occurring for a
Service and
determine which component types are malfunctioning. View a list of all active
alerts associated with the CI Type.
The upper table
lists
all CI Types for the selected
Service with alert
details such as the highest Alert Severity for the CI Type. The
color of each row represents the maximum Alert Impact.
The color of the Alert Severity column represents the
most critical
alert
state for each.
| |
One
or more alerts
exceeded their critical threshold for the
CI Type. |
| |
One
or more alerts
exceeded their warning threshold for the
CI Type. |
| |
No
alerts exceeded a threshold for the CI Type. |
Select a row for a CI Type that has an
active alert (the Alert Severity is red or yellow) to view the active
alerts in the lower table. Double-click a row to view a detailed list of CIs
associated with the CI Type in the Service Summary display.
In the lower table, each row is
a
different alert for a CI that is
associated with the CI Type selected from the upper table.
Filter display content by Owner,
Area, Group, Service and Environment.
Click the column header to
sort column data.

For details about display title bar functionality,
see Title Bar Functionality.
|
Owner |
Select an Owner to display in the table. |
|
Area |
Select an Area to display in the table. |
| Group |
Select
a Group to display in the table. |
| Service
|
Select
a Service to display in the table. |
| Env |
Select All
or a single Environment to display in the table. |
| |
| Service Name
|
The name of the
Service currently shown in the table. |
| CI Count |
The
total number of configurable items associated with the selected Service. |
| PROD |
The
number of CI instances associated with the Service in production
environments. |
| DEV |
The
number of CI instances associated with the Service in development
environments. |
| DR |
The
number of CI instances associated with the Service in the DR
environment. |
| UAT |
The
number of CI instances associated with the Service in the UAT
environment. |
| Criticality |
The
Criticality (rank of importance) specified in the Service Data Model (CMDB)
by your administrator.
Criticality values are listed in the Component Views /
CI Service Table
display, which range from A to E, where A is the
highest Criticality. This value is used to determine the value for
Alert Impact. |
| Max Severity |
The
highest Alert Severity value of any CI associated with the selected
Service. |
| Max Impact |
The
highest Alert Impact value of any CI associated with the selected
Service. |
| All CIs |
Opens
the Service Summary display. |
| |
| (CIType
Table) |
This
table lists all CI Types for the selected Service. Each row in the table is a
CI
Type.
Click a row to view details in the lower table about alerts
associated with the CI Type. Double-click a row to drill-down to Service Summary
display
describing alert details relevant to this CI Type. |
| CIType |
The type of CI. |
| CI
Count |
The total number of configurable items
associated with the CI
Type. |
|
Alert Severity |
Shows
the most critical alert state for the
CIs associated with the CI
Type. |
| |
One or
more alerts for the CIs associated with the CI
Type have exceeded the Critical threshold. |
| |
One or
more alerts for the CIs associated with the CI
Type have exceeded the Warning threshold. |
| |
No
alerts for the CIs associated with the CI
Type have exceeded a threshold. |
|
Alert Count |
The total number of active alerts for the CIs
associated with the CI
Type. |
| Quality
|
Shows whether performance metrics are being
received from the CIs associated with the CI
Type. |
| |
One or
more performance metrics are not being received from the CIs associated with the
CI
Type. |
| |
All performance metrics are being received from he CIs associated with the CI
Type. |
|
Quality Count |
Shows the number of CIs for that CI Type that
have a known state. It displays all when that number is the total
count of CI's. |
| |
One or
more performance metrics are not being received from the CIs associated with the
CI
Type. |
| |
All performance metrics are being received from the CIs associated with the CI
Type. |
| |
|
Alerts Table |
This
table lists all alerts for CIs associated with the CI Type selected.
Each row in the table is an alert. For details about table column data, see
Alerts Table.
|
|
Selected CI Type |
The CI
Type selected from the upper table. |
|
All CI Types |
Shows
all active alerts for all CIs associated with the CI
Type selected. |
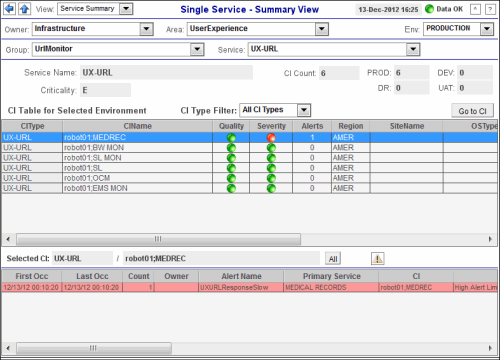
Service
Summary
View
alert states at the component-level
per Service, and obtain component details such as the number of active
alerts for the component, what operating system the component uses and the Data Server
associated with the component.
Use this display to
monitor a
Service in a specific Group or Environment anywhere in
your organization, and
determine whether a component is malfunctioning.
The table
lists
all
components
for a selected
Service.
Each row in the able is a
different CI (configurable item or component).
The row color represents the
most critical
alert
state in each.
| |
One
or more alerts
exceeded their critical threshold in the
Area. |
| |
One
or more alerts
exceeded their warning threshold in the
Area. |
Filter table content by Owner,
Area, Group, Service or Environment.
Use the
 sort button to
order column data.

For details about display title bar functionality,
see Title Bar Functionality.
|
Owner |
Select an Owner to display in the table. |
|
Area |
Select an Area to display in the table. |
| Group |
Select
a Group to display in the table. |
| Service
|
Select
a Service to display in the table. |
| Env |
Select All
or a single Environment to display in the table. |
| |
| Service Name
|
The name of the
Service currently shown in the table. |
| Criticality |
The
Criticality (rank of importance) specified in the Service Data Model (CMDB)
by your administrator.
Criticality values are listed in the Component Views /
CI Service Table
display, which range from A to E, where A is the
highest Criticality. This value is used to determine the value for
Alert Impact. |
| CI Count |
The
total number of configurable items associated with the selected Service. |
| PROD |
The
number of CI instances associated with the Service in production
environments. |
| DEV |
The
number of CI instances associated with the Service in development
environments. |
| DR |
The
number of CI instances associated with the Service in the DR
environment. |
| UAT |
The
number of CI instances associated with the Service in the UAT
environment. |
| |
| CI
Table for Selected Environment |
This
table lists all CIs for the selected Environment. Each row in the table is a CI.
Each CI can have multiple alerts. Click a row to view details about any alerts
associated with the CI in
the lower table. Double-click a row to drill-down to a summary page
describing information relevant to this CI. This action can also be
performed by selecting (a single click) on a row and selecting the Go to
CI button. |
| CI Type
Filter |
Select a CI Type to display in the table or
select All CI Types. |
|
Go to CI |
Drill-down to a summary page describing
information relevant to this CI. |
| CIType |
The type of CI. |
| CIName |
The
name or address of the CI. |
| Quality
|
Shows whether performance metrics are being
received from the CI. |
| |
Performance metrics are not being received from the CI. |
| |
Performance metrics are being received from the CI. |
| Severity |
Shows
the most critical alert state for the
selected
CI. |
| |
One or
more alerts for the CI have exceeded the Critical threshold. |
| |
One or
more alerts for the CI have exceeded the Warning threshold. |
| |
No
alerts for the CI have exceeded a threshold. |
| Alerts |
The
number of currently active alerts for the selected CI. |
| Region
|
The name of the
Region for the CI. |
| SiteName
|
The name of the
Site for the CI. |
| OSType
|
The
operating system currently running on the CI. |
| City
|
The name of the
City for the CI. |
| Country
|
The name of the
Country for the CI. |
|
Data Server |
The name of the
Data Server with which the CI
is associated. |
| |
|
Alerts Table |
This
table lists all alerts for the selected Service. Each row in
the table is an alert. For details about table column data, see
Alerts Table.
|
|
Selected CI |
For
the CI selected from the upper table: Type of CI / Name of CI. This field is
automatically populated if you want to filter the alerts by selecting to see
only the alerts raised for a particular CI. |
| All |
Click to show
all alerts for a Service in the CI Table.
|
 |
Opens the Alerts Table in a separate window.
|
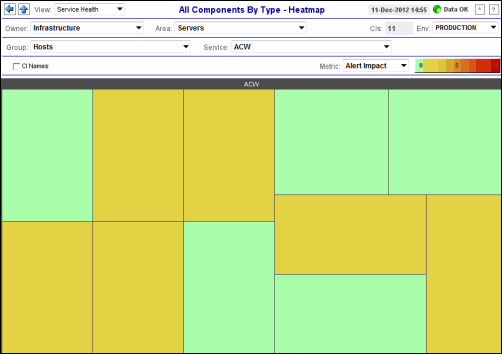
Service Health Heatmap
View heatmap of alert states
for CIs
associated with a
Service.
The heatmap
organizes
CIs
by
the Service
selected.
Each rectangle in the heatmap represents a
CI (for example, localhost-14).
Each Metric (selected from the drop-down menu) has a color gradient bar
that maps relative values to colors. Move your mouse over a rectangle to
see additional
values.
Use the drop-down menus to
filter data shown in the heatmap: a different Owner, Area,
Group or
Service,
one or all Environments, as
well as the alert Metric. By default, Alert Impact metrics are shown.
Optionally show CI Names.

For details about display title bar functionality,
see Title Bar Functionality.
|
Owner |
Select
an
Owner to display in the heatmap. |
|
Area |
Select
an
Area to display in the heatmap. |
| Group |
Select
a Service
to display in the heatmap. |
|
Service |
Select
a Group to display in the heatmap. |
| CIs |
The
total number of configurable items. |
| Env |
Select
one or all Environments to display in the heatmap. |
| |
| CI Names |
Display the CI
names in each heatmap rectangle. |
|
Metric |
Select
the metric to display in the heatmap. Each Metric has a color gradient bar
that maps relative values to colors. |
|
Alert
Impact |
The
highest
Alert
Impact value for any alert associated
with CIs in a given
rectangle. Values range
from 0 - 10, as indicated in the color gradient
 bar, where 10 is the highest
Alert
Impact.
The
Alert
Impact
is calculated for each
CI, which is the
product of the CI
Criticality times the current maximum Alert Severity. |
|
Alert Severity |
The
maximum level of alerts in a given heatmap rectangle. Values range from 0
- 2, as indicated in the color gradient
 bar, where 2 is the highest
Alert Severity.
 |
| |
Metrics that
have exceeded their specified ALARM LEVEL threshold have an
Alert Severity value of 2. For a given
heatmap rectangle, this indicates that one or more metrics
have reached their
alert thresholds.
|
| |
| |
Metrics that
have exceeded their specified WARNING LEVEL threshold have an
Alert Severity value of 1. For a given
heatmap rectangle, this indicates that one or more metrics
have reached their warning thresholds. |
| |
| |
Metrics that have not exceeded either specified threshold have an
Alert Severity value of 0. For a given
heatmap rectangle, this indicates that no metrics
have reached their warning or alert
thresholds. |
| |
|
Alert Count |
The
total number of critical and warning alerts in a given heatmap rectangle. The color gradient
 bar, populated by the current heatmap, shows the
value/color mapping. The numerical values in the gradient bar range from
0 to the maximum count of alerts in the heatmap. The middle value in the
gradient bar indicates the average alert count.
 |
|
Max Criticality |
The
maximum level of Criticality (rank of importance) in a given heatmap rectangle. Values range from 1 to 5, as indicated in the color gradient
 bar, where 5 is the highest Criticality.
Criticality is specified in the
Service Data Model (CMDB) by your administrator. Criticality values are listed in the Component Views /
CI Service Table
display, which range from A to E, where A is the
highest Criticality (level 5 maps to a Criticality of
A and level 1
maps to a Criticality of E with equally spaced intermediate values). |
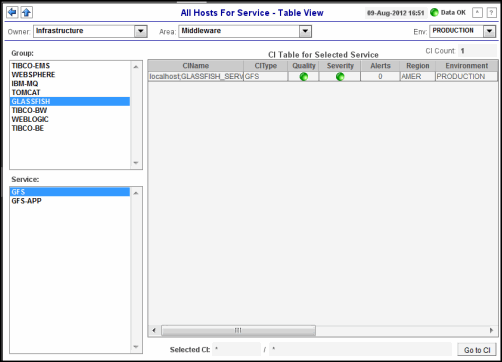
Service Browser
View
alert states at the component-level
per Service, and obtain component details such as the number of active
alerts for the component, what operating system the component uses and the Data Server
associated with the component.
Use this display
to monitor a
Service in a specific Group or Environment anywhere in
your organization, and
determine whether a component is malfunctioning.
The table
lists
all
components
for a selected
Service.
Each row in the able is a
different CI (configurable item or component).
The row color represents the
most critical
alert
state in each.
| |
One
or more alerts
exceeded their critical threshold in the
Area. |
| |
One
or more alerts
exceeded their warning threshold in the
Area. |
| |
No
alerts exceeded their thresholds in the
Area. |
Filter table content by Owner,
Area, Group, Service or Environment.
Use the
 sort button to
order column data.

For details about display title bar functionality,
see Title Bar Functionality.
|
Owner |
Select an Owner to display in the table. |
|
Area |
Select an Area to display in the table. |
| Group |
Select
a Group to display in the table. |
| Service
|
Select
a Service to display in the table. |
| Env |
Select All
or a single Environment to display in the table. |
| |
| CI Count |
The
total number of configurable items listed in the table.
|
| CI
Table |
This
table lists all CIs associated with the selected Service. Each row in
the table is a CI.
|
| CIName |
The name or address of the CI. |
| CIType |
The type of
CI. |
| Quality
|
Shows whether performance metrics are being
received from the CI. |
| |
Performance metrics are not being received from the CI. |
| |
Performance metrics are being received from the CI. |
| Severity |
The
maximum level of alerts for the CI. Values range from 0 to
2, where 2 is the greatest
Alert Severity. |
| |
One
or more alerts
exceeded their ALARM LEVEL threshold
for the CI. |
| |
One
or more alerts
exceeded their WARNING LEVEL threshold
for the CI. |
| |
No
alert thresholds have been exceeded for the
CI. |
| Alerts |
The total number
of critical and warning alerts for the CI. |
| Region
|
The name of the
Region for the CI. |
| SiteName
|
The name of the
Site for the CI. |
| OSType
|
The
operating system currently running on the CI. |
| City
|
The name of the
City for the CI. |
| Country
|
The name of the
Country for the CI. |
|
Data Server |
The name of the
Data Server the CI is associated with. |
| |
|
Selected CI |
The CIType and
CIName of the
selected CI. |
| Go to CI |
Opens
the relevant Summary display for the selected CI. |
|

