| Servers |
Click
to open the All Servers Heatmap
display. |
| Summary |
Click
to open the Single Server Summary
display for this server.
Toggle between
Summary
and
Tables. |
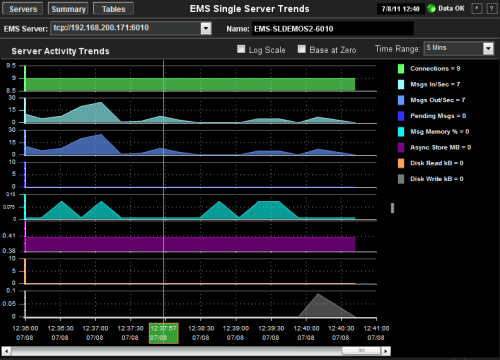
| Trends |
Click
to open the Single Server Trends display for
this server.
Toggle between
Summary
and
Trends. |
| Connection
Indicators |
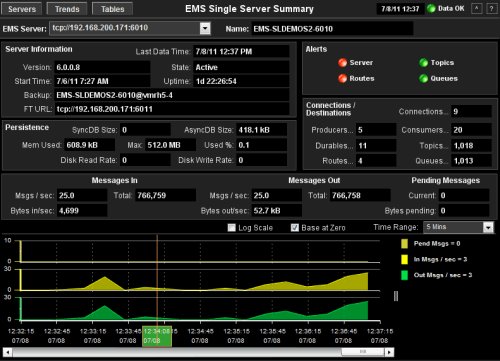
Date, Time |
The
current date and time. If the time is incorrect, this might indicate that RTView
stopped running. |
| Data OK |
The data connection state.
NOTE: When the Date, Time
field displays the correct time and Data OK indicator is green, this is a strong indication
that the EMS Monitor is receiving current and valid data. |
| Red |
The data source is
disconnected (for example, if the Data Server is not receiving data from
EMS, or if the Display Server does not receive data from the Data Server,
this will be red). |
| Green |
The data source is
connected. |
| |
| EMS Server
|
Select
an EMS server from the drop-down menu to view data for a specific server.
The selection made here populates this display. |
| Name |
The
name of the EMS server selected from the EMS Server drop-down menu. |
| |
|
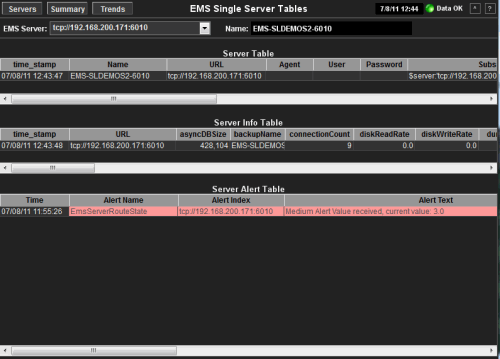
Server
Table |
This table
shows information about how the monitor is connected to the server. |
|
time_stamp |
The
date and time
this row
of data was last updated. |
|
Name |
The name of the
server. |
| URL |
The IP address and
port number for the
server. |
|
Agent |
If used, the name of the
RTView agent connecting to the EMS server. |
|
User |
The user name for
gaining access to the server. |
|
Password |
The password
associated with user
name for gaining access to the server. |
|
Subs |
RTView substitutions
used when connecting to this server. |
|
ConnName |
The name
of the RTView connection to this server. |
|
Active |
When checked,
indicates that the server is currently running. |
|
FaultTolerantStandbyMode |
When checked,
indicates that the server is running as a backup server. |
|
FaultTolerantURL |
The IP address and
port number for the backup server assigned to this server. |
|
BackupName |
The name of the
backup server assigned as backup to this server. |
| |
|
Server
Info Table |
This table
shows server metrics queried from the server. |
|
time_stamp |
The
date and time
this row
of data was last updated. |
| URL |
The IP address and
port number for the server. |
|
asyncDBSize |
The amount of
database space, in bytes, used by asynchronous data on the server. |
| backupName |
The name of the
backup server assigned as backup to this server. |
|
connectionCount |
The number of
currently connected clients. |
|
diskReadRate |
The speed at which
the server reads disk data. |
|
diskWriteRate |
The speed at which
the server writes data to disk. |
|
durableCount |
The number of
currently active durables. |
|
FaultTolerantURL |
The IP address
and port number, or the hostname and port number, of the fault tolerant
standby server assigned to this server. |
|
inboundBytesRate |
The rate of
inbound messages in bytes per second. |
|
inboundMessageCount |
The number of
inbound messages received by the server since the server was started. |
|
inboundMessageRate |
The rate of
inbound messages in number of messages per second. |
|
maxMessageMemory |
The maximum amount
of memory, in bytes, allocated for use by messages on the server. |
|
messageMemory |
The amount of
memory, in bytes, currently used by messages on the server. |
|
messageMemoryPct |
The amount of
memory, in percent, used by messages on the server. |
|
messageMemoryPooled |
The currently
allocated pool size for messages in bytes. |
|
outboundBytesRate |
The rate of
outbound messages in bytes per second. |
|
outboundMessageCount |
The number of
outbound messages sent by the server since the server was started. |
|
outboundMessageRate |
The rate of
outbound messages in number of messages per second |
|
pendingMessageCount |
The number of
currently pending messages on the server. |
|
pendingMessageSize |
The amount of
space, in bytes, pending messages use on the server. |
|
processId |
The process ID
of the EMS server. |
|
queueCount |
The number of
message queues. |
|
serverName |
The name of the
server. |
|
startTime |
The date and time
that the server was started. |
|
state |
The server status:
Active: The server is currently
processing requests.
Inactive: The server is not
currently processing requests.
Standby: The server is
functioning as a backup for a primary server.
|
|
syncDBSize |
The amount of
database space, in bytes, used by synchronous data on the server. |
|
topicCount |
The number of
currently active topics. |
|
upTime |
The amount of
time, in milliseconds, since the server was started. |
|
versionInfo |
The TIBCO EMS
software version currently running. |
|
Host |
The name or IP
address for the host server. |
|
Expired |
Data has
not been received from this server in the specified amount of time. The
server will be removed from the EMS Monitor in the specified amount of time.
The default setting is 35 seconds. |
| |
|
Server
Alert Table |
Contains all available data for alerts that have been activated. Click an
alert to view details in the Alert Detail window. |
|
Time |
The
time the alert was first activated. |
|
Alert Name |
The name of the
alert. |
|
Alert Index |
The EMS server which
activated the alert. |
|
Alert Text |
The text that is
displayed for the alert. |
|
Clr'd |
When checked,
the alert thresholds are
no longer out of bounds and the alert has cleared. |
|
Ack'd |
When checked,
a user has indicated
that they have acknowledged the alert. |
| ID |
The unique
identifier for this alert instance. |
|
Last Update Time |
The time that the
alert status was updated. |
|
Comments |
User-supplied comments
about this alert. |
|
Owner |
The user who has
accepted ownership of this alert. |
|
Cleared Reason |
The reason the
alert was cleared. |
|
Cleared Time |
The time that the
alert was cleared. |
|
Count |
The number
of times a new data update has been received but the alert has not cleared. |
|
Package |
The RTView package
reporting the alert. |
|
Category |
The alert
category: Server, Queue or Topic.
|
|
DrillUpSuffix |
Information
about a display related to this alert. |
|
Expired |
The alert had
a defined expiration time and has expired (cleared). |
|
AlertIndex1 |
The EMS
server that caused the alert (primary index). |
|
AlertIndex2 |
The secondary
index (for example, a queue or a topic) that has generated the alert. |