Using the Monitor - EMS Clients
These displays
present performance metrics for all server connections,
including users, routes between servers, producers, consumers and durables
connected to a specific
EMS server.
-
Connections, Users, Ports:
Shows utilization metrics
for connections on a single server.
-
Routes:
Shows utilization metrics for server
routes on a single server.
-
Producers:
Shows utilization metrics for
producers on a single server.
-
Consumers:
Shows utilization metrics for
consumers on a single server.
-
Durables:
Shows
utilization metrics for durables on
a single server.
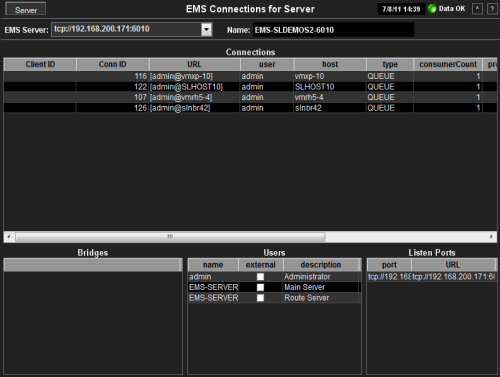
Connections, Users, Ports
Track utilization metrics
for connections on a single server.
NOTE: Click the
 button to view
the current display in a new window. button to view
the current display in a new window.
| Server |
Click
to open the Single Server
Summary
display.
|
|
Connection Indicators |
Date, Time |
The
current date and time. If the time is incorrect, this might indicate that RTView
stopped running. |
| Data OK |
The data connection state.
NOTE: When the Date, Time
field displays the correct time and Data OK indicator is green, this is a strong indication
that the EMS Monitor is receiving current and valid data. |
| Red |
The data source is
disconnected (for example, if the Data Server is not receiving data from
EMS, or if the Display Server does not receive data from the Data Server,
this will be red). |
| Green |
The data source is
connected. |
| |
| EMS Server
|
Select
an EMS server from the drop-down menu to view connections for a specific server.
The selection made here populates this display. |
| Name |
The
name of the EMS server selected from the EMS Server drop-down menu. |
| |
| Connections |
This table describes the current connections on the selected server. |
| Client ID |
The
unique string identifier assigned to the
client. |
| Conn ID |
The unique
numeric ID assigned to this connection that can be used for deletion. |
| URL |
The
connection URL. |
| user |
The user name. |
| host |
The name of the host the
server is connected to. |
| type |
The type of
connection: Queue, Topic
or System. |
| consumerCount |
The total number
of consumers currently connected. |
| producerCount |
The total number
of producers currently connected. |
| sesionCount |
The total number
of current sessions. |
| startTime |
The
epoch time
stamp when the connection started. |
| upTime |
The amount of
time, in milliseconds, the client has been connected. |
| |
|
Bridges |
This table describes the bridges for the selected server. |
|
Users |
This table describes the users on the selected server. |
| name |
The name of the
connected user. |
| external |
When checked, the user is
defined in an
external system. |
| description |
Textual description of the user. |
|
Listen Ports |
This table describes the connections
the selected server is to listen for. |
| port |
The IP
address and port number on which the server is to listen for connections. |
| URL |
The URL on
which the server is to listen for connections. |
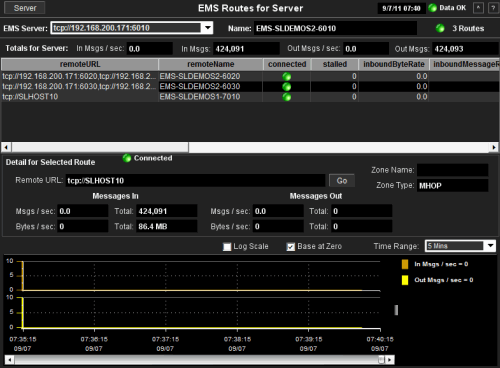
Routes
Track utilization metrics
for server routes on a single server. Inbound metrics, such as
inboundByteRate, indicate an in route to the server. Outbound metrics, such
as outboundByteRate, indicate an out route to the server.
NOTE: Click the
 button to view
the current display in a new window. button to view
the current display in a new window.
| Server |
Click
to open the Single Server
Summary
display.
|
|
Connection Indicators |
Date, Time |
The
current date and time. If the time is incorrect, this might indicate that RTView
stopped running. |
| Data OK |
The data connection state.
NOTE: When the Date, Time
field displays the correct time and Data OK indicator is green, this is a strong indication
that the EMS Monitor is receiving current and valid data. |
| Red |
The data source is
disconnected (for example, if the Data Server is not receiving data from
EMS, or if the Display Server does not receive data from the Data Server,
this will be red). |
| Green |
The data source is
connected. |
| |
| EMS Server
|
Select
an EMS server from the drop-down menu to view server routes for a specific server.
The selection made here populates this display. |
| Name |
The
name of the EMS server selected from the EMS Server drop-down menu. |
| Routes |
The number of server routes and the connection state.
Red: One or more routes for this
server are disconnected.
Green: All routes for this server are connected.
Gray: There are no routes for this
server.
|
| |
| Totals For
Server |
Shows
metrics for all server routes on the selected server. |
| In Msgs / sec |
The
number of incoming messages, per second. |
| In Msgs |
The
total number of incoming messages. |
| Out Msgs / sec |
The
number of outgoing messages, per second. |
| Out Msgs |
The
total number of outgoing messages. |
| |
| Table |
This table shows metrics for each
server route on the selected server. Select a route to view details. |
| Remote URL |
The
URL of the remote server. |
| Remote Name |
The
name of the remote server. |
| connected |
When checked, the server route is connected.
|
| stalled |
Indicates whether the
IO flow stalled on the route.
A value of 0 (zero) = not
stalled.
A value of
1 (zero) = stalled.
|
| inboundByteRate |
The rate of
inbound data in bytes, per second. |
|
inboundMessageRate |
The rate of
inbound messages in number of messages per second. |
|
inboundTotalBytes |
The total
number of inbound bytes. |
|
inboundTotalMessages |
The total
number of inbound messages. |
| outboundByteRate |
The rate of
outbound data in bytes per second. |
| outboundMessageRate |
The rate of
outbound
messages in number of messages per second. |
| outboundTotalBytes |
The total
number of outbound bytes. |
| outboundTotalMessages |
The total
number of outbound messages. |
| zoneName |
The name
of the zone for the route. |
| zoneType |
Indicates
a multi-hop
or one-hop zone. |
| active |
Indicates whether the
server route is currently transferring data:
1 = true
0 = false
|
| inactive |
Indicates whether the server route is currently transferring data:
1 = true
0 = false
|
| suspended |
Indicates whether outgoing
messages to the route have been suspended:
1 = true
0 = false |
| remoteURLName
|
The IP
address and name for the remote connection. |
| |
| Detail for Selected Route |
Shows metrics for
the server route selected from the table. |
| Connected |
The
server route connection state.
Red: The server route is disconnected.
Green: The server route is connected. |
| Zone Name |
The name
of the zone for the route. |
| Remote URL |
The IP
address and port number for the server route connection. |
| Zone Type |
Indicates
a multi-hop
or one-hop zone. |
|
Messages In |
Msgs/sec |
The number of
incoming messages, per second. |
| Total |
The total number
of incoming messages since the connection was
established. |
| Bytes/sec |
The amount of
incoming messages, in bytes per second, for this server route. |
| Total |
The amount of
incoming messages, in kilobytes, for this server route since the connection was
established. |
|
Messages Out |
Msgs/sec |
The number of
outgoing messages, per second. |
| Total |
The total number
of outgoing messages since the connection was
established. |
| Bytes/sec |
The amount of
outgoing messages, in bytes per second. |
| Total |
The amount of
outgoing messages, in kilobytes, since the connection was
established. |
| |
| Log Scale |
Use a
logarithmic scale for the Y axis. |
| Base at Zero |
Use
zero as the Y axis minimum for all graph traces. |
| Time Range |
Select
a time range in which to display data varying from 2 Minutes to
Last 7 Days, or select All Data. |
|
Trend Graphs |
| Shows
message data for the selected route. |
| In Msgs / sec |
Traces
the number of incoming messages, per second. |
| Out Msgs / sec |
Traces
the number of outgoing messages, per second. |
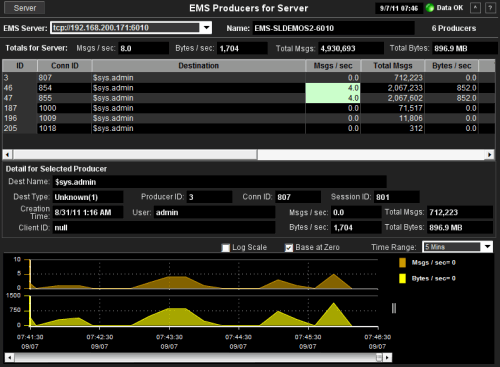
Producers
Track utilization metrics
for producers on a single server.
NOTE: Click the
 button to view
the current display in a new window. button to view
the current display in a new window.
| Server |
Click
to open the Single Server
Summary
display.
|
|
Connection Indicators |
Date, Time |
The
current date and time. If the time is incorrect, this might indicate that RTView
stopped running. |
| Data OK |
The data connection state.
NOTE: When the Date, Time
field displays the correct time and Data OK indicator is green, this is a strong indication
that the EMS Monitor is receiving current and valid data. |
| Red |
The data source is
disconnected (for example, if the Data Server is not receiving data from
EMS, or if the Display Server does not receive data from the Data Server,
this will be red). |
| Green |
The data source is
connected. |
| |
| EMS Server
|
Select
an EMS server from the drop-down menu to view data for a specific server.
The selection made here populates this display. |
| Name |
The
name of the EMS server selected from the EMS Server drop-down menu. |
| Producers |
The number of currently connected producers on the server.
|
| |
| Totals For
Server |
Msgs / sec |
The
number of messages, per second, for the producer. |
| Bytes / sec |
The
amount of messages, in bytes per second, for the producer. |
| Total Msgs |
The
total number of messages for the producer. |
| Total Bytes |
The
total size of messages, in bytes, for the producer. |
| |
| Table |
This
table shows metrics for each producer on the selected server. |
| ID |
A unique
string identifier assigned to each
producer. |
| Destination |
The name of the
destination. |
| Msgs / sec |
The
number of messages, per second, for the producer. |
| Total Msgs |
The
total number of messages for the producer. |
| Bytes / sec |
The
size of messages, in bytes per second, for the producer. |
| Total Bytes |
The
total size of messages, in bytes, for the producer. |
| User |
The
user name. |
| URL |
The IP address and port number of
the server. |
| Client ID |
A unique string identifier assigned to each client. |
| connectionID |
A unique string identifier assigned to each connection. |
| sessionID |
A unique string identifier assigned to each session. |
| destinationType |
The
configured
destination type. |
| createTime |
The amount of time, in
milliseconds, since the
producer was created. |
| time_stamp |
The date
and time
this row of
data was last updated. |
| |
| Detail for Selected Producer |
Shows metrics for
the producer selected from the table. |
| Dest Name |
The name of the destination. |
| Dest Type |
The
configured
destination type. |
| Creation Time |
The amount of time, in milliseconds, since the
producer was created. |
| Client ID |
A unique string identifier assigned to each client. |
| Producer ID |
A unique string identifier assigned to each producer. |
| User |
The user name. |
| Conn ID |
A unique string identifier assigned to each connection. |
| Session ID |
A unique string identifier assigned to each session. |
| Msgs/sec |
The number of
messages, per second, for the producer. |
| Total Msgs |
The total number
of messages for the producer. |
| Bytes/sec |
The size of
messages, in bytes per second, for the producer. |
| Total Bytes |
The total size
of messages, in bytes, for the producer. |
| |
| Log Scale |
Use a
logarithmic scale for the Y axis. |
| Base at Zero |
Use
zero as the Y axis minimum for all graph traces. |
| Time Range |
Select
a time range in which to display data varying from 2 Minutes to
Last 7 Days, or select All Data. |
|
Trend Graphs |
| Shows
message data for the selected producer. |
| Msgs / sec |
Traces
the number of
messages for the producer, per second. |
| Bytes / sec |
Traces
the size of
messages for the producer, in bytes. |
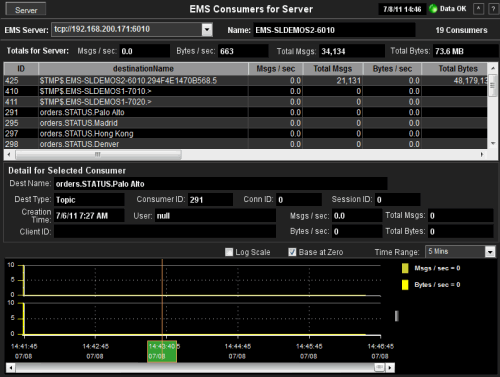
Consumers
Track utilization metrics
for consumers on a single server.
NOTE: Click the
 button to view
the current display in a new window. button to view
the current display in a new window.
| Server |
Click
to open the Single Server
Summary
display.
|
|
Connection Indicators |
Date, Time |
The
current date and time. If the time is incorrect, this might indicate that RTView
stopped running. |
| Data OK |
The data connection state.
NOTE: When the Date, Time
field displays the correct time and Data OK indicator is green, this is a strong indication
that the EMS Monitor is receiving current and valid data. |
| Red |
The data source is
disconnected (for example, if the Data Server is not receiving data from
EMS, or if the Display Server does not receive data from the Data Server,
this will be red). |
| Green |
The data source is
connected. |
| |
| EMS Server
|
Select
an EMS server from the drop-down menu to view data for a specific server.
The selection made here populates this display. |
| Name |
The
name of the EMS server selected from the EMS Server drop-down menu. |
| Consumers |
The number of currently connected consumers on the server.
|
| |
| Totals For
Server |
Msgs / sec |
The
number of messages, per second, for the consumer. |
| Bytes / sec |
The
size of messages, in bytes per second, for the consumer. |
| Total Msgs |
The
total number of messages for the consumer. |
| Total Bytes |
The
total size of messages, in bytes, for the consumer. |
| |
|
Table |
This
table shows metrics for each consumer on the selected server. |
| ID |
A unique
string identifier assigned to each
consumer. |
| destinationName |
The name of the
destination. |
| Msgs / sec |
The
number of messages, per second, for the consumer. |
| Total Msgs |
The
total number of messages for the consumer. |
| Bytes / sec |
The
size of messages, in bytes per second, for the consumer. |
| Total Bytes |
The
total size of messages, in bytes, for the consumer. |
| User |
The user name. |
| URL |
The IP address and port number of
the consumer. |
| Client ID |
A unique string identifier assigned to each client. |
| connectionID |
A unique string identifier assigned to each connection. |
| sessionID |
A unique string identifier assigned to each session. |
| destinationType |
The
configured
destination type. |
| durableName |
The name of the durable.
|
| createTime |
The amount of time, in
milliseconds, since the
consumer was created. |
| time_stamp |
The date
and time
this row of
data was last updated. |
| |
| Detail for
Selected Consumer |
Shows
metrics for the
consumer
selected from the table. |
| Dest Name |
The name of the
destination. |
| Dest Type |
The
configured
destination type. |
| Creation Time |
The amount of time, in milliseconds, since the
consumer was created. |
| Client ID |
A unique
string identifier assigned to each client. |
| Consumer ID |
A unique
string identifier assigned to each consumer. |
| User |
The user name. |
| Conn ID |
A unique
string identifier assigned to each connection. |
| Session ID |
A unique
string identifier assigned to each session. |
| Msgs/sec |
The number of
messages from the consumer per second. |
| Total Msgs |
The total number
of messages for the consumer. |
| Bytes/sec |
The size of
messages, in bytes per second, for the consumer. |
| Total Bytes |
The total size
of messages, in bytes, for the consumer. |
| |
| Log Scale |
Use a
logarithmic scale for the Y axis. |
| Base at Zero |
Use
zero as the Y axis minimum for all graph traces. |
| Time Range |
Select
a time range in which to display data varying from 2 Minutes to
Last 7 Days, or select All Data. |
|
Trend Graphs |
| Shows
message data for the selected consumer. |
| Msgs / sec |
Traces
the number of
messages for the consumer, per second. |
| Bytes / sec |
Traces
the size of messages for the consumer, in bytes. |
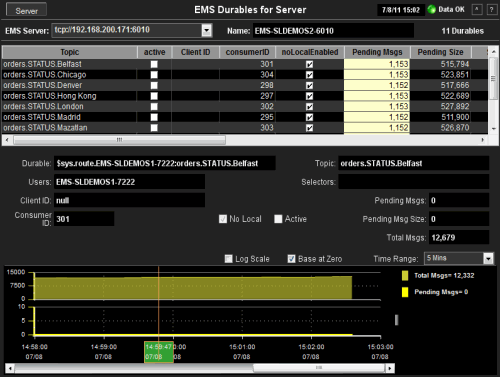
Durables
Track utilization metrics
for durables on a single server.
NOTE: Click the
 button to view
the current display in a new window. button to view
the current display in a new window.
| Server |
Click
to open the Single Server
Summary
display.
|
|
Connection Indicators |
Date, Time |
The
current date and time. If the time is incorrect, this might indicate that RTView
stopped running. |
| Data OK |
The data connection state.
NOTE: When the Date, Time
field displays the correct time and Data OK indicator is green, this is a strong indication
that the EMS Monitor is receiving current and valid data. |
| Red |
The data source is
disconnected (for example, if the Data Server is not receiving data from
EMS, or if the Display Server does not receive data from the Data Server,
this will be red). |
| Green |
The data source is
connected. |
| |
| EMS Server
|
Select
an EMS server from the drop-down menu to view data for a specific server.
The selection made here populates this display. |
| Name |
The
name of the EMS server selected from the EMS Server drop-down menu. |
| Durables |
The number of currently connected durables on the server.
|
| |
| Table |
This
table shows metrics for each durable on the selected server.
|
| Topic |
The name of the
topic. |
| Active |
Indicates
whether the durable is active. |
| Client ID |
A unique
string identifier assigned to each client. |
| Consumer ID |
A unique
string identifier assigned to each consumer. |
| NotLocalEnabled |
Indicates
whether the subscriber receives messages from all connections its local
connection.
Enabled: The
subscriber does not receive messages sent from its local connection.
Disabled:
The subscriber receives messages from all connections. |
| Pending Msgs |
The total number
of pending messages for the selected durable. |
| Pending Size |
The total amount
of pending messages, in bytes, for the selected durable. |
| Selector |
Indicates
that the subscriber only receives messages that match this selector. |
| UserName |
The name
of the user
of this durable subscriber. |
| Name |
The full name
of the
durable subscriber. |
| time_stamp |
The date
and time
this row of
data was last updated. |
| |
| Durable |
The
name of the durable selected from the table. |
| Users |
The names
of the users
of this durable subscriber. |
| Client ID |
A unique
string identifier assigned to each client. |
| Consumer ID |
A unique
string identifier assigned to each consumer. |
| Topic |
The
name of the topic. |
| Selectors |
Indicates
that the subscriber only receives messages that match this selector. |
| No Local |
Indicates
whether the subscriber receives messages from all connections its local
connection.
Enabled: The
subscriber does not receive messages sent from its local connection.
Disabled:
The subscriber receives messages from all connections. |
| Active |
Indicates
whether the durable is active. |
| Pending Msgs |
The
total number of pending messages for the selected durable. |
| Pending Msg
Size |
The
total size of pending messages, in bytes, for the selected durable. |
| Total Msgs |
The
total number of pending messages for the selected durable. |
| |
| Log Scale |
Use a
logarithmic scale for the Y axis. |
| Base at Zero |
Use
zero as the Y axis minimum for all graph traces. |
| Time Range |
Select
a time range in which to display data varying from 2 Minutes to
Last 7 Days, or select All Data. |
|
Trend Graphs |
| Shows
message data for the selected durable. |
| Msgs / sec |
Traces
the number of
messages for the durable, per second. |
| Bytes / sec |
Traces
the size of
messages for the durable, in bytes per second. |
|

