Using the Monitor - All EMS Servers
These displays
present performance metrics and alert status for all EMS servers.
The first three displays show different views of the same data:
-
All Servers
Heatmap: Heatmap shows server and
alert status for all EMS servers.
-
All Servers
Table: Table
shows all available utilization metrics for all EMS
servers.
-
All Servers
Grid: Grid
enables you to see general performance of EMS
servers
in parallel.
If you have few servers, this
display is useful for
verifying servers are active and generally performing as expected.
The last display provides a
high-level view of servers and their connections:
-
All Servers Topology:
Topographical map shows server routes, as well as the status of active
servers and standby servers that form a fault-tolerant pair.
All Servers
Heatmap
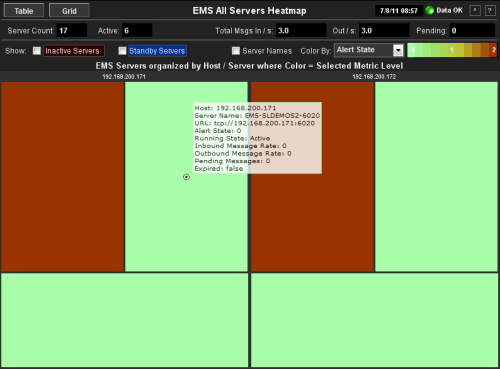
View status and alerts of all EMS servers. The heatmap is organized by host, each rectangle representing a server. The size
of the graphic area per server is the same for each server.
Click on a node
to drill-down
to the Single Server
Summary display and view metrics for a particular server. Select the
metric to display in the heatmap from the
Color By drop-down menu.
Toggle between the commonly
accessed Table, Grid and Heatmap displays. Mouse-over
rectangles to view more details about host performance and status.
NOTE: Click the
 button to view
the current display in a new window. button to view
the current display in a new window.

| Table |
Click
to open the All Servers Table display.
Toggle between the Table, Grid
and
Heatmap displays. |
| Grid |
Click
to open the All Servers Grid display.
Toggle between the Table, Grid and Heatmap
displays. |
| Connection
Indicators |
Date, Time |
The
current date and time. If the time is incorrect, this might indicate that RTView
stopped running. |
| Data OK |
The data connection state.
NOTE: When the Date, Time
field displays the correct time and Data OK indicator is green, this is a strong indication
that the EMS Monitor is receiving current and valid data. |
| Red |
The data source is
disconnected (for example, if the Data Server is not receiving data from
EMS, or if the Display Server does not receive data from the Data Server,
this will be red). |
| Green |
The data source is
connected. |
| |
| Server Count |
The
total number of active, inactive and standby EMS servers. |
| Active |
The
total number of currently active EMS servers. |
|
Total Msgs In/s |
In/s: |
The total number
of incoming messages, per second, from all producers and consumers on all
EMS servers. |
|
Out/s: |
The total number
of outgoing messages, per second, from all producers and consumers on all
EMS servers. |
|
Pending |
The total number
of pending messages waiting to be processed on all EMS
servers. |
| |
|
Show |
Select
the type of servers to display data for. By
default, all active servers are displayed. |
| Inactive
Servers |
Select to include
servers that are not
currently
running.
Inactive Servers are represented in
red. |
| Standby Servers |
Select to include
servers that are currently in Standby mode. Standby Servers
are represented in blue. |
| Server Names |
Select to display
the names of servers on the hosts. |
| Color By |
Select
the metric to display in the heatmap.
The color
range next to the Color By drop-down
list
shows the values in white text.
|
|
Alert State |
Select to display
server alert states:
Green: Alerts for the server
are currently in a normal state.
Yellow: One or more alerts for
the server is in a warning state.
Red: One or more alerts for the
server is in a critical state.
|
|
Pend Msgs |
Select to display
the status of pending messages:
Green: A normal number of
pending messages are on the server.
Yellow: A high number
of pending messages are on the server.
Red: A critical number of
pending messages are on the server.
|
| In
Msg Rate |
Select to display
the incoming message rate:
Green: A normal number of
incoming messages are on the server.
Yellow: A high number
of incoming messages are on the server.
Red: A critical number of
incoming messages are on the server. |
| Out
Msg Rate |
Select to display
the outgoing message rate:
Green: A normal number of
outgoing messages are on the server.
Yellow: A high number
of outgoing messages are on the server.
Red: A critical number of
outgoing messages are on the server. |
|
Heatmap |
The heatmap organizes the servers by host,
each rectangle (node) representing a server.
The size of the rectangle
is the same for each server
(regardless of server metrics).
Mouse-over any node to display the current
values for the metric selected from the Color By drop-down menu.
Click on a node to drill-down to the
Single Server Summary
display and view metrics for a particular server.
The current values of the heatmap color
range are displayed on the color gradient bar.
Select the metric to display in the heatmap
from the Color By drop-down
menu.
Toggle between Table, Grid and
Heatmap displays.
To access more content in this display, click the
 button to open
the display in a new window. button to open
the display in a new window. |
All Servers
Table
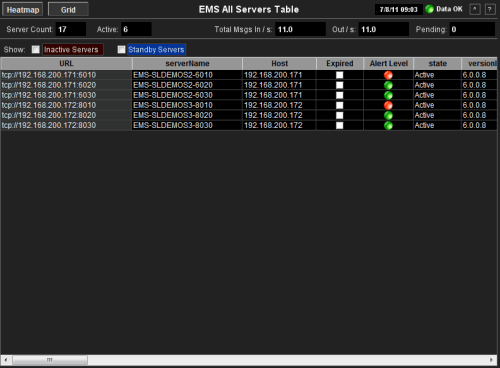
Investigate detailed utilization
metrics
for all EMS servers. The All Servers Table contains
all metrics available for servers,
including the number of current client connections. Each row in the
table contains data for a particular server. Click a column header to sort
column data in numerical or alphabetical order. Click on a table
row to drill-down
to the Single Server
Summary display and view metrics for that particular server.
Toggle between the commonly
accessed Table, Grid and Heatmap displays.
NOTE: Click the
 button to view
the current display in a new window. button to view
the current display in a new window.

| Heatmap |
Click
to open the All Servers Heatmap display.
Toggle between Table, Grid and
Heatmap displays. |
| Grid |
Click
to open the All Servers Grid display.
Toggle between
Table, Grid and Heatmap
displays. |
| Connection
Indicators |
Date, Time |
The
current date and time. If the time is incorrect, this might indicate that RTView
stopped running. |
| Data OK |
The data connection state.
NOTE: When the Date, Time
field displays the correct time and Data OK indicator is green, this is a strong indication
that the EMS Monitor is receiving current and valid data. |
| Red |
The data source is
disconnected (for example, if the Data Server is not receiving data from
EMS, or if the Display Server does not receive data from the Data Server,
this will be red). |
| Green |
The data source is
connected. |
| |
| Server Count |
The
total number of active, inactive and standby EMS servers. |
| Active |
The
total number of currently active EMS servers. |
|
Total Msgs In/s |
In/s: |
The total number
of incoming messages, per second, from all producers and consumers on all
EMS servers. |
|
Out/s: |
The total number
of outgoing messages, per second, from all producers and consumers on all
EMS servers. |
|
Pending |
The total number
of incoming and outgoing messages waiting to be processed on all EMS
servers. |
| |
|
Show |
Select
the type of servers to display data for. By
default, all active servers are displayed. |
| Inactive
Servers |
Select to include
servers that are not processing requests in the table. |
| Standby Servers |
Select to include
servers that are not
currently
running.
Inactive Servers are represented in
red. |
|
Table |
This
table shows
information for all EMS servers. Click on
a table row to drill-down to the Single Server
Summary display and view metrics for that particular server. |
| URL |
Select to include
servers that are currently in Standby mode. Standby Servers
are represented in blue. |
|
serverName |
The name of the
server. |
|
Host |
The name or
IP address for the host server. |
|
Expired |
Data has
not been received from this server in the specified amount of time. The
server will be removed from the EMS Monitor in the specified amount of time.
The default setting is 35
seconds. |
|
Alert Level |
The alert status
for the server: Green: Alerts for the server
are currently in a normal state.
Yellow: One or more alerts for
the server is in a warning state.
Red: One or more alerts for the
server is in a critical state. |
|
state |
The server status:
Active: The server is currently
processing requests.
Inactive: The server is not
currently processing requests.
Standby: The server is
functioning as a backup for a primary server.
|
|
versionInfo |
The TIBCO EMS
software version currently running.
|
|
faultTolerantURL |
The IP
address and port number, or the hostname and port number, of the fault
tolerant standby server assigned to this server.
|
|
asyncDBSize |
The amount of
database space, in bytes, occupied by asynchronous data on the server. |
|
backupName |
The name of the
backup server assigned as the backup to this server. |
|
connectionCount |
The number of
clients currently connected to the server. |
|
diskReadRate |
The speed at which
the server reads disk data. |
|
diskWriteRate |
The speed at which
the server writes data to disk. |
|
durableCount |
The number of
durables on the server. |
|
inboundBytesRate |
The rate of
inbound messages in bytes per second. |
|
inboundMessageCount |
The number of
inbound messages received by the server since the server was started. |
|
inboundMessageRate |
The rate of
inbound messages in number of messages per second. |
|
maxMessageMemory |
The maximum amount
of memory, in bytes, allocated for use by messages on the server. |
|
messageMemory |
The amount of
memory, in bytes, currently used by messages on the server. |
|
messageMemoryPct |
The amount of
memory, in percent, used by messages on the server. |
|
messageMemoryPooled |
The currently
allocated pool size, in bytes, for messages. |
|
outboundBytesRate |
The rate of
outbound messages in bytes per second. |
|
outboundMessageCount |
The number of
outbound messages sent by the server since the server was started. |
|
outboundMessageRate |
The rate of
outbound messages in number of messages per second |
|
pendingMessageCount |
The number of
currently pending messages on the server. |
|
pendingMessageSize |
The amount of
space, in bytes, pending messages use on the server. |
|
processId |
The process
ID of the EMS server. |
|
queueCount |
The number of
message queues. |
|
startTime |
The date and time
that the server was started. |
|
syncDBSize |
The amount of
database space, in bytes, occupied by synchronous data on the server. |
|
topicCount |
The number of
currently active topics on the server. |
|
upTime |
The amount of
time, in milliseconds, since the server was started. |
|
time_stamp |
The date and time
this row of data was last updated. |
All Servers
Grid
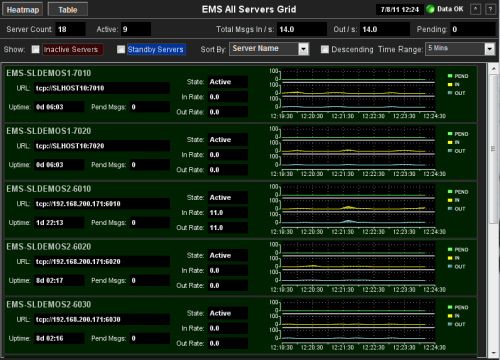
Track and view in
parallel the general performance
of all EMS servers. Click on a node to drill-down
to the Single Server
Summary display and view detailed metrics for that particular server.
NOTE: Click the
 button to view
the current display in a new window. button to view
the current display in a new window.

| Heatmap |
Click
to open the All Servers Heatmap display.
Toggle between Table, Grid and
Heatmap displays. |
| Table |
Click
to open the All Servers Table display.
Toggle between
Table, Grid and Heatmap
displays. |
| Connection
Indicators |
Date, Time |
The
current date and time. If the time is incorrect, this might indicate that RTView
stopped running. |
| Data OK |
The data connection state.
NOTE: When the Date, Time
field displays the correct time and Data OK indicator is green, this is a strong indication
that the EMS Monitor is receiving current and valid data. |
| Red |
The
data source is disconnected (for example, if the Data Server is not
receiving data from EMS, or if the Display Server does not receive data from
the Data Server, this will be red). |
| Green |
The
data source is connected. |
| |
| Server Count |
The
total number of active, inactive and standby EMS servers. |
| Active |
The
total number of currently active EMS servers. |
|
Total Msgs In/s |
In/s: |
The
total number of incoming messages, per second, from all producers and
consumers on all EMS servers. |
|
Out/s: |
The
total number of outgoing messages, per second, from all producers and
consumers on all EMS servers. |
|
Pending |
The
total number of incoming and outgoing messages waiting to be processed on
all EMS servers. |
| |
|
Show |
Select
the type of servers to display data for. By default, all active servers are
displayed. |
| Inactive
Servers |
Select
to include servers that are not processing requests in the heatmap.
Inactive Servers
are represented in red. |
| Standby Servers |
Select
to include servers that are not processing requests in the heatmap.
Standby Servers
are represented in blue. |
|
Sort By |
Server Name |
Select
to organize the servers in the grid by server name. |
| Server URL |
Select
to organize the servers in the grid by server URL. |
| Descending |
When
checked, lists servers in the grid in descending order. |
| Time Range |
Select
a time range in which to display data varying from 2 Minutes to
Last 7 Days, or select All Data. |
| |
|
Grid |
Server Name |
The name of the server. |
| URL |
The
URL for the server. |
|
Uptime |
The
amount of time, in milliseconds, since the server was started. |
|
Pend Msgs |
The
number of currently pending messages on the server. |
|
State |
The
server status:
Active: The server is currently
processing requests.
Inactive: The server is not
currently processing requests.
Standby: The server is
functioning as a backup for a primary server. |
| In
Rate |
The rate
of inbound messages in messages per second. |
| Out
Rate |
The rate
of outbound messages in messages per second. |
|
Trend Graph |
Shows
message data for the server. |
| Pend |
Traces the total number
of pending messages on the server. |
| In |
Traces the
rate
of inbound messages in messages per second. |
| Out |
Traces the
rate
of outbound messages in messages per second. |
All Servers
Topology
View server topology for all EMS servers. Click on a node to drill-down
to the Single Server
Summary display and view metrics for that particular server.
NOTE: Click the
 button to view
the current display in a new window. button to view
the current display in a new window.

| Route Table |
Click
to open the Server Route Table display in a new window. The Server Route Table display generates the server topology. |
| Connection
Indicators |
Date, Time |
The
current date and time. If the time is incorrect, this might indicate that RTView
stopped running. |
| Data OK |
The data connection state.
NOTE: When the Date, Time
field displays the correct time and Data OK indicator is green, this is a strong indication
that the EMS Monitor is receiving current and valid data. |
| Red |
The data source is
disconnected (for example, if the Data Server is not receiving data from
EMS, or if the Display Server does not receive data from the Data Server,
this will be red). |
| Green |
The data source is
connected. |
| |
|
Show |
By
default, all active servers are displayed. |
| Inactive
Servers |
Select
to show servers that are not processing requests in the topology.
Inactive Servers
are represented in red. |
| Standby Servers |
Select
to show servers that are not processing requests in the topology.
Standby Servers
are represented in blue. |
|
Connected Routes Only |
Select to show only
routes that have an active connection. |
| Show Metrics |
Available on desktop application deployments only. Shows the total input
message rates, per second, on the top of each server icon and the total
output message rate on the bottom of each server icon. |
| |
| Topology |
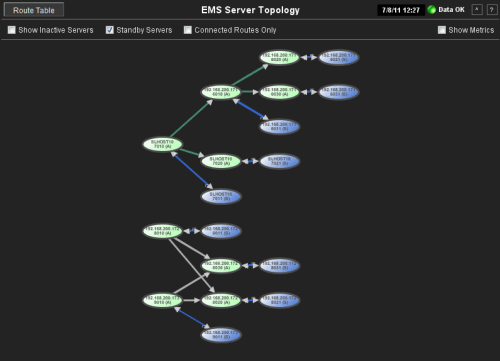
Routes
are shown between the active server and the standby server which form a
fault-tolerant pair. Either of the servers in a fault-tolerant pair can
become the active server or the standby server. Show Standby Servers
and Show Inactive Servers enable you to include or exclude standby
and inactive servers. By default, standby servers are included in the
topology and inactive servers are not.
Typically, it takes about 30 seconds for a server to appear in the display
after startup.
The active server in a fault-tolerant pair appears in green with the suffix
(A) appended to its URL. The standby server appears in blue, with the
suffix (S) appended to its URL. Their link is blue and labeled FT.
If the active server fails:
- the failed server becomes inactive, its
suffix changes to (X!), and the node turns red with a red
outline.
- the standby server becomes active, its
suffix changes to (A!), and the node turns green with a red
outline.
- the link between the two servers turns
red.
If the standby server fails:
- the failed server becomes inactive, its
suffix changes to (X!), and the node turns red with a red
outline.
- the active servers' suffix changes to (A!)
and it is outlined in red.
- the link between the two servers turns
red.
If a failed server recovers:
- the recovered server becomes the standby
server, its suffix changes to (S), and the node turns blue with a
grey outline.
- the active servers' suffix (A!)
changes to (A), and the red node outline changes back to grey.
- the link between the two servers changes
back to blue.
|
| Suffix
Definition |
A |
This is the active server and it is running.
|
| A! |
This is the active server and it is running
but its standby has failed. |
| S |
This is the standby server and it is running.
|
| X! |
The server is inactive.
|
| Node Color
Definition |
Green |
This is
the active server and it is running. |
|
Blue |
This is
the standby server and it is in standby mode. |
|
Red |
The server is inactive.
|
| Link Color
Definition |
Blue |
The two servers in
the pair are running. |
|
Red |
One of
the servers in the pair is inactive. |
| Outline Color
Definition |
Grey |
The two servers
in the pair are running. |
|
Red |
One of
the servers in the pair is inactive. If the node color indicates this server is
running, its pair is inactive. |
|

