Track the performance of Tomcat application sessions and get Tomcat hosting and connection details. Use this data to verify response times of your Web applications.
|
Title Bar: Indicators and functionality might include the following: |
||||
|
|
|
|||
Note: Clicking All Tomcats in the Title Bar takes you to the All Tomcat Servers Table display. Clicking All Apps in the Title Bar takes you to the Tomcat Applications Activity Heatmap display. Clicking JVM takes you to the JVM CPU/Mem Summary display.
|
Fields and Data This display includes: |
|||
|
|
Source |
Select the host where the Tomcat Server is running. |
|
|
|
Connection |
Select a Tomcat server from this dropdown. |
|
|
|
Connected |
The Connection state.
|
|
|
|
Expired |
When checked, this server is expired due to inactivity. |
|
|
|
Host Name |
The name of the host where the application resides. |
|
|
|
App Base |
The directory in which Tomcat is installed. |
|
|
|
Auto Deploy |
When checked, indicates that Tomcat option, automatic application deployment, is enabled. Note: This Tomcat option is set using the autoDeploy property in the server.xml file, located in the Tomcat conf directory. autoDeploy=true enables the option. |
|
|
|
Deploy On Startup |
When checked, indicates that the option to deploy the application on Tomcat startup is enabled. Note: This Tomcat option is set using the deployOnStartup property in the server.xml file, located in the Tomcat conf directory. When enabled (deployOnStartup=true), applications from the host are automatically deployed. |
|
|
|
Connectors |
This table shows Tomcat application connection information. |
|
|
|
|
Protocol |
The protocol used by the Tomcat application on the host. |
|
|
Port |
The port number used by the Tomcat application on the host. |
|
|
|
RedirectPort |
The redirect port number used by the Tomcat application on the host. |
|
|
|
|
Secure |
When checked, specifies that the Tomcat application uses a secure connection on the host. |
|
|
Current Statistics |
Active Sessions |
The number of clients currently in session with the servlet. |
|
|
|
Page Access / sec |
The number of times pages are accessed, per second. |
|
|
|
Cache Hits / sec |
The number of times the cache is accessed, per second. |
|
|
|
Requests / sec |
The number of requests received, per second. |
|
|
|
Bytes Rcvd / sec |
The number of bytes received, per second. |
|
|
|
Bytes Sent / sec |
The number of bytes sent, per second. |
|
|
|
Process Time |
The amount of time, in milliseconds, for the servlet to process client requests. |
|
|
Totals |
Sessions |
The total number of client sessions since the server was started. |
|
|
|
Accesses |
The total number of page accesses since the server was started. |
|
|
|
Requests |
The total number of requests since the server was started. |
|
|
|
Bytes Rcvd (KB) |
The number of Kilobytes received per second, since the server was started. |
|
|
|
Bytes Sent (KB) |
The total number of bytes sent, in Kilobytes, since the server was started. |
|
|
Session / Data / Latency Trends |
Log Scale |
This option should be used when the range of your data is very broad. When checked, the values are displayed using a logarithmic scale rather than using the actual values so that data on the extreme ends of the scale can be viewed more effectively. For example, if you have data that ranges from the tens to the thousands, the data in the range of the tens will be neglected visually if you do not check this option.
|
|
|
|
Base at Zero |
When this option is checked, zero is set as the as the Y axis minimum for all graph traces.
|
|
|
|
Time Range |
Select a time range from the drop down menu varying from 2 Minutes to Last 7 Days, or display All Data. To specify a time range, click the 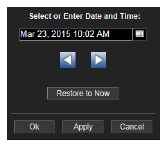
By default, the time range end point is the current time. To change the time range end point, click the Use the navigation arrows Click Restore to Now to reset the time range end point to the current time.
|
|
|
|
Trend Graphs |
Shows metrics for the selected server. Active Sessions -- Traces the number of currently active client sessions. Requests /sec -- Traces then umber of requests received, per second. Process Time -- Traces the average amount of time, in milliseconds, to process requests. |


 Open the online help page for this display.

 button.
 button and select a date and time from the calendar or enter the date and time in the text field using the following format:
  to move forward or backward one time period.