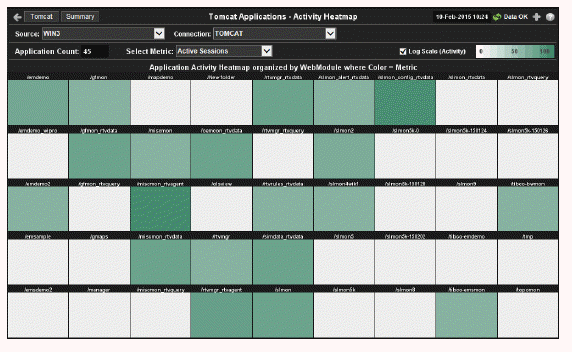
View performance metrics for all monitored Tomcat Web modules for one Tomcat Server. The heatmap organizes Tomcat Web modules by server, and uses color to show the most critical Metric value for each Tomcat connection associated with the selected source. Each rectangle in the heatmap represents a Web module. In this heatmap, the rectangle size is the same for all Web modules. Each Metric (selected from the drop-down menu) has a color gradient bar that maps relative values to colors.
Use this display to see the health of all your web applications at-a-glance. You can select the heatmap color metric from a list including active sessions, access rate, and total access count.
Use the available drop-down menus to filter data shown in the display. Use the check-boxes to include or exclude labels in the heatmap. Move your mouse over a rectangle to see additional information. Drill-down and investigate by clicking a rectangle in the heatmap to view details for the selected Web module in the Tomcat Modules Summary display.

|
Title Bar: Indicators and functionality might include the following: |
||||
|
|
|
|||
Note: Clicking Tomcat in the Title Bar takes you to the Tomcat Server Summary display. Clicking Summary in the Title Bar takes you to the Tomcat Modules Summary display.
|
Fields and Data This display includes: |
|||
|
|
Source |
Select the host where the Tomcat Server is running. |
|
|
|
Connection |
Select a Tomcat Server from the drop-down menu. |
|
|
|
Application Count |
The number of Tomcat applications in the heatmap. |
|
|
|
Select Metric |
Select the metric to display in the heatmap. Each metric (Active Sessions, Current Access Rate, and Total Access Count) has a color gradient bar that maps relative values to colors. The color gradient bar |
|
|
|
Log Scale (Activity) |
This option should be used when the range of your data is very broad. When checked, the values are displayed using a logarithmic scale rather than using the actual values so that data on the extreme ends of the scale can be viewed more effectively. For example, if you have data that ranges from the tens to the thousands, the data in the range of the tens will be neglected visually if you do not check this option.
|
|