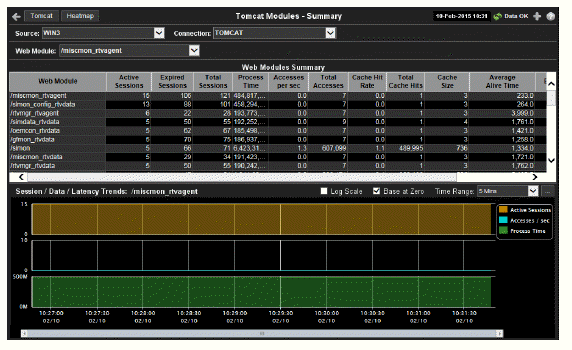
Track the performance of Tomcat application modules and get utilization details. Use this data to verify response times of your Web application modules.
|
Title Bar: Indicators and functionality might include the following: |
||||
|
|
|
|||
Note: Clicking Tomcat in the Title Bar takes you to the Tomcat Server Summary display. Clicking Heatmap in the Title Bar takes you to the Tomcat Applications Activity Heatmap display.
|
Fields and Data This display includes: |
|||
|
|
Source |
Select the host where the Tomcat Server is running. |
|
|
|
Connection |
Select a Tomcat Server from the drop-down menu. This menu is populated by the selected Source. |
|
|
|
Web Module |
Select a Web module from the drop-down menu. |
|
|
|
Web Modules Summary |
This table describes the selected Web module. |
|
|
|
|
Web Module |
The name of the Web module. |
|
|
|
Active Sessions |
The number of currently active client sessions. |
|
|
|
Expired Sessions |
The total number of client sessions that expired since the application was started. |
|
|
|
Total Sessions |
The total number of client sessions since the application was started. |
|
|
|
Process Time |
The average amount of time, in milliseconds, to process requests. |
|
|
|
Accesses per sec |
The number of times pages are accessed, per second. |
|
|
|
Total Accesses |
The total number of times pages have been accessed since the application was started. |
|
|
|
Cache Hit Rate |
The number of times the cache is accessed, per second. |
|
|
|
Total Cache Hits |
The total number of times the cache has been accessed since the application was started. |
|
|
|
Cache Size |
The size of the cache. |
|
|
|
Average Alive Time |
The average time the web module is up. |
|
|
|
Expired |
When checked, this connection is expired due to inactivity. |
|
|
|
time_stamp |
The date and time this row of data was last updated. Format: MM/DD/YY HH:MM:SS <month>/ <day>/<year> <hours>:<minutes>:<seconds> |
|
|
Session / Data / Latency Trends: /emsmgr |
Log Scale |
This option should be used when the range of your data is very broad. When checked, the values are displayed using a logarithmic scale rather than using the actual values so that data on the extreme ends of the scale can be viewed more effectively. For example, if you have data that ranges from the tens to the thousands, the data in the range of the tens will be neglected visually if you do not check this option.
|
|
|
|
Base at Zero |
When this option is checked, zero is set as the as the Y axis minimum for all graph traces.
|
|
|
|
Time Range |
Select a time range from the drop down menu varying from 2 Minutes to Last 7 Days, or display All Data. To specify a time range, click the 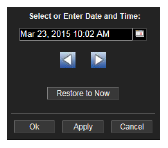
By default, the time range end point is the current time. To change the time range end point, click the Use the navigation arrows Click Restore to Now to reset the time range end point to the current time.
|
|
|
|
Trend Graphs |
Shows metrics for the selected server. Active Sessions -- Traces the number of currently active client sessions. Accesses /sec -- Traces the number of times pages are accessed, per second. Process Time -- Traces the average amount of time, in milliseconds, to process requests. |


 Open the online help page for this display.
  button.
 button and select a date and time from the calendar or enter the date and time in the text field using the following format:
  to move forward or backward one time period.