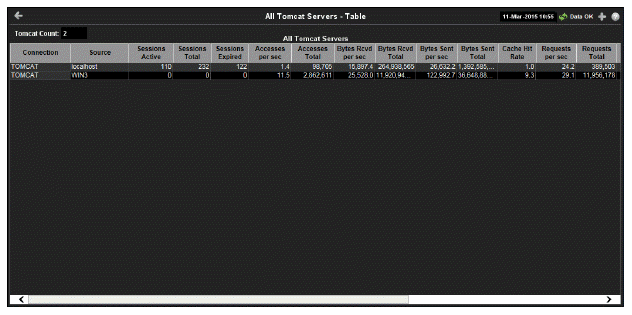
View Tomcat Server details per connection such as the total number of sessions, bytes sent/received, and processing time. Each row in the table is a different Tomcat Server. The row color for inactive connections is dark red.
Use this display to see summary information for your Tomcat servers, including session counts, access and request rates, cache hit rates, and data transmission metrics.

|
Title Bar: Indicators and functionality might include the following: |
||||
|
|
|
|||
|
Fields and Data This display includes: |
|||
|
|
Tomcat Count |
The number of Tomcat connections in the table. |
|
|
|
All Tomcat Servers Table |
Lists the Tomcat Connections. |
|
|
|
Connection |
The name of the Tomcat connection. |
|
|
|
Source |
The host where the Tomcat Server is running. |
|
|
|
Sessions Active |
The number of currently active client sessions. |
|
|
|
Sessions Total |
The total number of client sessions since the server was started. |
|
|
|
Sessions Expired |
The total number of client sessions that expired since the server was started. |
|
|
|
Accesses per sec |
The number of times pages are accessed, per second. |
|
|
|
Accesses Total |
The total number of times pages have been accessed since the server was started. |
|
|
|
Bytes Rcvd per sec |
The number of bytes received per second. |
|
|
|
Bytes Rcvd Total |
The total number of bytes received since the server was started. |
|
|
|
Bytes Sent per sec |
The number of bytes sent per second. |
|
|
|
Bytes Sent Total |
The total number of bytes sent since the server was started. |
|
|
|
Cache Hit Rate |
The number of times the cache is accessed, per second. |
|
|
|
Requests per sec |
The number of requests received, per second. |
|
|
|
Requests Total |
The total number of requests received since the server was started. |
|
|
|
Process Time |
The average amount of time, in milliseconds, to process requests. |
|
|
|
Error Count |
The number of errors that have occurred since the server was started. |
|
|
|
appBase |
The directory in which Tomcat is installed. |
|
|
|
name |
The host name. |
|
|
|
Display Name |
The name of the currently open display. |
|
|
|
Expired |
When checked, this connection is expired due to inactivity. |
|
|
|
time_stamp |
The date and time this row of data was last updated. Format: MM/DD/YY HH:MM:SS <month>/ <day>/<year> <hours>:<minutes>:<seconds> |
|