 to include or exclude labels in the heatmap. Move your mouse over a rectangle to see additional information. Drill-down and investigate by clicking a rectangle in the heatmap to view details for the selected connection in the JVM Summary display.
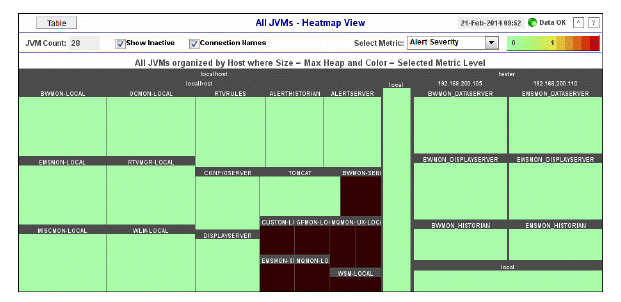
 View the most critical alert state for all monitored JVM connections, as well as CPU and memory utilization. The heatmap organizes JVM connections by source and host, and uses color to show the most critical Metric value for each JVM connection associated with that source. Each rectangle in the heatmap represents a JVM connection. The rectangle size represents the amount of memory reserved for that process; a larger size is a larger value. Each Metric (selected from the drop-down menu) has a color gradient bar that maps relative values to colors.
Use the check-boxes to include or exclude labels in the heatmap. Move your mouse over a rectangle to see additional information. Drill-down and investigate by clicking a rectangle in the heatmap to view details for the selected connection in the JVM Summary display.

|
Title Bar: Indicators and functionality might include the following: |
||||
|
|
|
|||
|
Fields and Data This display includes: |
|||
|
|
JVM Count
|
The number of JVM connections shown in the display. |
|
|
|
Show Inactive |
Check the Show Inactive box to include inactive connections. |
|
|
|
Connection Names |
Check the box to display the names of the JVM connections. |
|
|
|
Metric Select the Metric to display in the heatmap. Each Metric has a color gradient bar that maps relative values to colors. |
||
|
|
|
Alert Severity |
The maximum level of alerts in the heatmap rectangle. Values range from 0 - 2, as indicated in the color gradient
|
|
|
|
CPU % |
The total percent (%) CPU utilization for the rectangle. The color gradient |
|
|
|
Memory % |
The total percent (%) memory utilization for the rectangle. The color gradient |