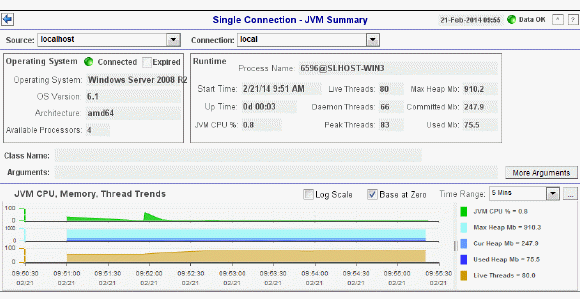
Track JVM memory and CPU usage, get JVM system information, application performance metrics, and input arguments for a single connection. Verify whether the memory usage has reached a plateau. Or, if usage is getting close to the limit, determine whether to allocate more memory.
Use the available drop-down menus to filter data shown in the display.

|
Title Bar: Indicators and functionality might include the following: |
||||
|
|
|
|||
|
Fields and Data This display includes: |
|||
|
|
Source |
Select the type of connection to the RTView Server. |
|
|
|
Connection |
Select an RTView Server from the drop-down menu. Names can be modified in the RTView Server configuration properties file. |
|
|
|
Operating System Displays data pertaining to the operating system running on the host on which the JVM resides. |
||
|
|
|
Connected |
The data connection state:
|
|
|
Expired |
When checked, this server is expired due to inactivity. |
|
|
|
Operating System |
The name of the operating system running on the host on which the JVM resides. |
|
|
|
OS Version |
The operating system version. |
|
|
|
Architecture |
The ISA used by the processor. |
|
|
|
Available Processors |
The total number of processors available to the JVM. |
|
|
|
Runtime |
||
|
|
|
Process Name |
Name of the process. |
|
|
Start Time |
The date and time that the application started running. |
|
|
|
Up Time |
The amount of time the application has been running, in the following format: 0d 00:00 <days>d <hours>:<minutes>:<seconds> For example: 10d 08:41:38 |
|
|
|
JVM CPU % |
The amount of CPU usage by the JVM, in percent. |
|
|
|
Live Threads |
The total number of live threads. |
|
|
|
Daemon Threads |
The total number of live daemon threads. |
|
|
|
Peak Threads |
The total number of peak live threads since the JVM started or the peak was reset. |
|
|
|
Max Heap Mb |
The maximum amount of memory used for memory management by the application in the time range specified. This value may change or be undefined. NOTE: A memory allocation can fail if the JVM attempts to set the Used memory allocation to a value greater than the Committed memory allocation, even if the amount for Used memory is less than or equal to the Maximum memory allocation (for example, when the system is low on virtual memory). |
|
|
|
Committed Mb |
The amount of memory, in megabytes, guaranteed to be available for use by the JVM. The amount of committed memory can be a fixed or variable size. If set to be a variable size, the amount of committed memory can change over time, as the JVM may release memory to the system. This means that the amount allocated for Committed memory could be less than the amount initially allocated. Committed memory will always be greater than or equal to the amount allocated for Used memory. |
|
|
|
Used Mb |
The amount of memory currently used by the application. Memory used includes the memory occupied by all objects including both reachable and unreachable objects. |
|
|
|
Class Name |
Class name used for JVM. |
|
|
|
Arguments |
The arguments used to start the application. |
|
|
|
More Arguments |
Additional arguments used to start the application. |
|
|
|
JVM CPU, Memory, Thread Trends Shows JVM metrics for the selected server. |
||
|
|
|
Log Scale |
Enable to use a logarithmic scale for the Y axis. Use Log Scale to see usage correlations for data with a wide range of values. For example, if a minority of your data is on a scale of tens, and a majority of your data is on a scale of thousands, the minority of your data is typically not visible in non-log scale graphs. Log Scale makes data on both scales visible by applying logarithmic values rather than actual values to the data. |
|
|
Base at Zero |
Use zero as the Y axis minimum for all graph traces. |
|
|
|
Time Range |
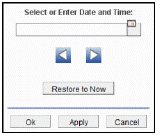
Select a time range from the drop down menu varying from 2 Minutes to Last 7 Days, or display All Data. To specify a time range, click Calendar 
By default, the time range end point is the current time. To change the time range end point, click Calendar Use the navigation arrows Click Restore to Now to reset the time range end point to the current time.
|
|
|
|
JVM CPU % |
Traces the amount of memory, in percent, used by the JVM in the time range specified. |
|
|
|
Max Heap Mb |
Traces the maximum amount of memory used for memory management by the application in the time range specified. This value may change or be undefined. NOTE: A memory allocation can fail if the JVM attempts to set the Used memory allocation to a value greater than the Committed memory allocation, even if the amount for Used memory is less than or equal to the Maximum memory allocation (for example, when the system is low on virtual memory). |
|
|
|
|
Cur Heap Mb |
Traces the current amount of memory, in megabytes, used for memory management by the application in the time range specified. |
|
|
Used Heap Mb |
Traces the memory currently used by the application. |
|
|
|
Live Threads |
Traces the total number of currently active threads in the time range specified. |
|