Using the Platform - Multi Area Service Views
In these displays, aggregated data
for alert states are organized by
Area
and shows all
Services, while highlighting
the most critical alert states using
color.
Data can be filtered by Owner,
Area,
Group,
Environment and alert Metric.
Use these displays, for
example, to isolate the Area and Environment in which a critical alert is
occurring. If you see a critical alert, get information by comparing alert
Metrics (such as how many other items are potentially affected).
These displays drill-down to the
Service By CI Type
display.
The
Multi Area Service Views
displays present data in tabular and heatmap
formats.
-
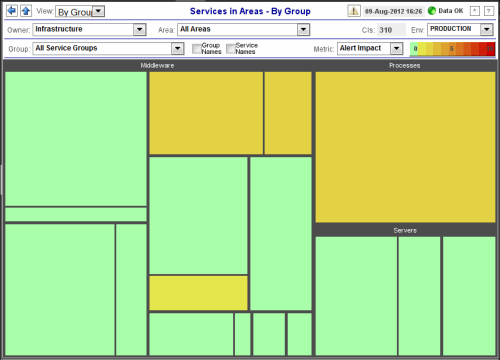
Group / Service Heatmap:
Heatmap of alert states for Services by Area,
with
the option to filter by
Area,
Group,
Environment and alert Metric, and the option to show Group
and Service Names.
-
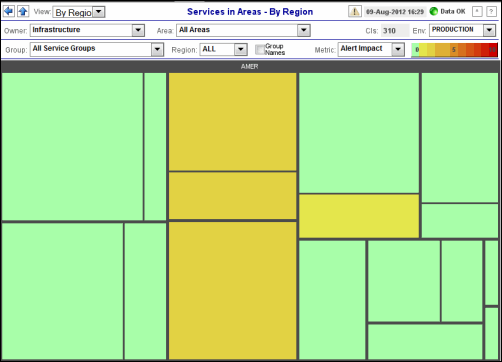
Group / Region Heatmap:
Heatmap as described for the Group / Service Heatmap (above), with
the option to filter by Region
and no option to show
Service Names.
-
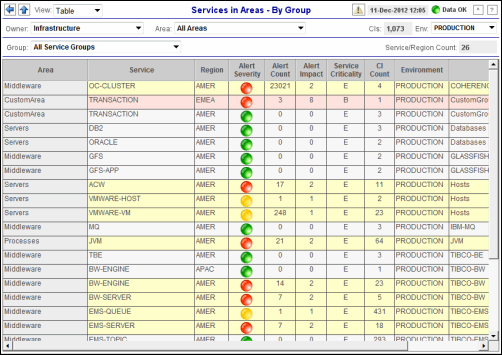
Group / Service Table:
Table of all Multi Area Service Views
data.
Group / Service Heatmap
View
heatmap of alert states for
Services in
one or all Areas,
filter by Group
or
Environment, and optionally show Service Names.
The heatmap
organizes Services
by one or all
Areas.
Each rectangle in the heatmap represents a
Service (for example, Applications, Demo Systems and so forth),
which are grouped by Area.
The rectangle size represents the number of CIs in the
Service; a larger size is a larger value.
Each Metric (selected from the drop-down menu) has a color gradient bar
that maps relative values to colors. Move your mouse over a rectangle to
see additional information.
Use the drop-down menus to
filter data shown in the heatmap: a different Owner,
one or all Areas,
one or all Environments, as
well as the alert Metric. By default, all
Areas, all
Environments, all Groups and Alert Impact are shown.
Drill-down and investigate by
clicking a
rectangle in the heatmap to view details in the Service By CI Type
display.

For details about display title bar functionality,
see Title Bar Functionality.
|
Owner |
Select All Owners or a single
Owner to display in the heatmap. |
|
Area |
Select All
Areas or a single
Area to display in the heatmap. |
| CIs |
The
total number of configuration items. This value is determined by the
selections made from display drop-down menus. |
| Group |
Select All
Service Groups
or a single Group to display in the heatmap. |
|
Region |
Select
All or a single Region
to display in the heatmap. |
| Group Names |
Display the Group names in each heatmap rectangle. |
|
Service Names |
Display the service names in each heatmap rectangle. |
| Env |
Select All
or a single Environment to display in the heatmap. |
|
Metric |
Select
the metric to display in the heatmap. Each Metric has a color
gradient bar that maps relative values to colors. |
|
Alert
Impact |
The
maximum of the products of maximum Alert Severity multiplied by the
Criticality of all CIs in a given heatmap rectangle. Values range
from 0 - 10, as indicated in the color gradient
 bar, where 10 is the highest
Alert
Impact.
|
|
Alert Severity |
The
maximum level of alerts in a given heatmap rectangle. Values range from 0
- 2, as indicated in the color gradient
 bar, where 2 is the highest
Alert Severity.
 |
| |
Metrics that
have exceeded their specified ALARM LEVEL threshold have an
Alert Severity value of 2. For a given
heatmap rectangle, this indicates that one or more metrics
have reached their
alert thresholds.
|
| |
| |
Metrics that
have exceeded their specified WARNING LEVEL threshold have an
Alert Severity value of 1. For a given
heatmap rectangle, this indicates that one or more metrics
have reached their warning thresholds. |
| |
| |
Metrics that have not exceeded either specified threshold have an
Alert Severity value of 0. For a given
heatmap rectangle, this indicates that no metrics
have reached their warning or alert
thresholds. |
| |
|
Alert Count |
The
total number of critical and warning alerts in a given heatmap rectangle.
The color gradient
 bar values range from
0 to the maximum count of alerts in the heatmap.
 |
|
Criticality |
The
maximum level of Criticality (rank of importance) in a given heatmap
rectangle. Values range from 1 to 5, as indicated in the color gradient
 bar, where 5 is the highest Criticality.
Criticality is specified in the
Service Data Model (CMDB) by your administrator. Criticality values are listed in the Component Views /
CI Service Table
display, which range from A to E, where A is the
highest Criticality (level 5 maps to a Criticality of
A and level 1
maps to a Criticality of E with equally spaced intermediate values). |
Group /
Region
Heatmap
View
heatmap of alert states
for one or all Services, Areas,
Environment or
Regions, and optionally show Service Names.
The heatmap
organizes CIs by
one or all
Groups.
Each rectangle in the heatmap represents a Group,
which are grouped by Area.
The rectangle size represents the number of CIs in the
Service; a larger size is a larger value.
Each Metric (selected from the drop-down menu) has a color gradient bar
that maps relative values to colors. Move your mouse over a rectangle to
see additional information.
Use the drop-down menus to
filter data shown in the heatmap: a different Owner,
one or all Areas,
one or all Environments,
one or all Regions, as
well as the alert Metric. By default, all
Areas, all
Environments, all Groups,
all Regions, and alert Impact are shown.
Drill-down and investigate by
clicking a
rectangle in the heatmap to view details in
the Service By CI Type
display.

For details about display title bar functionality,
see Title Bar Functionality.
|
Owner |
Select All Owners or a single
Owner to display in the heatmap. |
|
Area |
Select All
Areas or a single
Area to display in the heatmap. |
| CIs |
The
total number of configuration items. This value is determined by the
selections made from display drop-down menus. |
| Group |
Select All
Service Groups
or a single Group to display in the heatmap. |
|
Region |
Select All
or a single Region
to display in the heatmap. |
| Env |
Select All
or a single Environment to display in the heatmap. |
| Group Names |
Display the Group names in each heatmap rectangle. |
|
Metric |
Select
the metric to display in the heatmap. Each Metric has a color gradient bar
that maps relative values to colors. |
|
Alert
Impact |
The
maximum of the products of maximum Alert Severity multiplied by the
Criticality of all CIs in a given heatmap rectangle. Values range
from 0 - 10, as indicated in the color gradient
 bar, where 10 is the highest
Alert
Impact.
|
|
Alert Severity |
The
maximum level of alerts in a given heatmap rectangle. Values range from 0
- 2, as indicated in the color gradient
 bar, where 2 is the highest
Alert Severity.
 |
| |
Metrics that
have exceeded their specified ALARM LEVEL threshold have an
Alert Severity value of 2. For a given
heatmap rectangle, this indicates that one or more metrics
have reached their
alert thresholds.
|
| |
| |
Metrics that
have exceeded their specified WARNING LEVEL threshold have an
Alert Severity value of 1. For a given
heatmap rectangle, this indicates that one or more metrics
have reached their warning thresholds. |
| |
| |
Metrics that have not exceeded either specified threshold have an
Alert Severity value of 0. For a given
heatmap rectangle, this indicates that no metrics
have reached their warning or alert
thresholds. |
| |
|
Alert Count |
The
total number of critical and warning alerts in a given heatmap rectangle.
The color gradient
 bar values range from
0 to the maximum count of alerts in the heatmap.
 |
|
Criticality |
The
maximum level of Criticality (rank of importance) in a given heatmap
rectangle. Values range from 1 to 5, as indicated in the color gradient
 bar, where 5 is the highest Alert
Criticality.
Criticality is specified in the
Service Data Model (CMDB) by your administrator. Criticality values are listed in the Component Views /
CI Service Table
display, which range from A to E, where A is the
highest Criticality (level 5 maps to a Criticality of
A and level 1
maps to a Criticality of E with equally spaced intermediate values). |
Group / Service Table
This table displays data
shown in the Group/Service and Group/Region Heatmaps.
View Service metrics (Impact,
Severity, Count and Criticality, and CI Count)
for one or all
Areas, Owners,
Groups and Environments, and
compare
detailed metrics across all Areas in your organization.
The table lists
Services by
Owner and Area. Each row in the
table is a
different Service.
The row color represents the maximum Alert Impact in that Service.
The color of the circle in the Alert Severity column represents the most
critical alert state for that Service.
| |
One
or more alerts
exceeded their critical threshold in the
Area. |
| |
One
or more alerts
exceeded their warning threshold in the
Area. |
Use the drop-down menus to
filter data shown in the table: a different Owner, one or all Areas,
one or all Groups, or
one or all Environments. Drill-down and investigate by
clicking a row
in the table to view details in
the Service By CI Type
display.

For details about display title bar functionality,
see Title Bar Functionality.
|
Owner |
Select All
Owners or a single Owner to display in the table. |
|
Area |
Select All
Areas or a single
Area to display in the table. |
| CIs |
The
total number of configuration items. This value is determined by the
selections made from display drop-down menus. |
| Env |
Select All
or a single Environment to display in the table. |
| Group |
Select All
Service Groups
or a single Group to display in the table. |
|
Service/Region Count |
The
total number of Services listed in the table. This value is
determined by the selections made from display drop-down menus. |
| |
| Area
|
The name of the
Area where the alert data originated. |
| Service
|
The name of the
Service
to which the alert applies. |
| Region
|
The name of the
Region
to which the Service applies. |
|
Alert Severity |
The
maximum level of alerts for the Service. Values range from 0 to
2, where 2 is the greatest
Alert Severity. |
| |
One
or more alerts
exceeded their ALARM LEVEL threshold
for the Service. |
| |
One
or more alerts
exceeded their ALARM LEVEL threshold
for the Service. |
| |
No
alert thresholds have been exceeded for the Service. |
| Alert
Count |
The total number
of critical and warning alerts for the Service. |
| Alert Impact |
The
maximum of the products of maximum Alert Severity multiplied by the
Criticality of all CIs for the Service.
Values range from 0 - 10, where 10 is the highest
Alert Impact.
|
| Service Criticality |
The
Criticality (rank of importance) specified in the Service Data Model (CMDB)
by your administrator.
Criticality values are listed in the Component Views /
CI Service Table
display, which range from A to E, where A is the
highest Criticality. |
| CI Count |
The
total number of configuration items associated with the Service. |
| Environment |
The name of the
Environment
to which the Service applies. |
| Group |
The name of the
Group to which the Service applies. |
|

