|
|
Oracle Coherence Monitor
User Guide |
|
|
Using the Monitor -
Alert Views
The
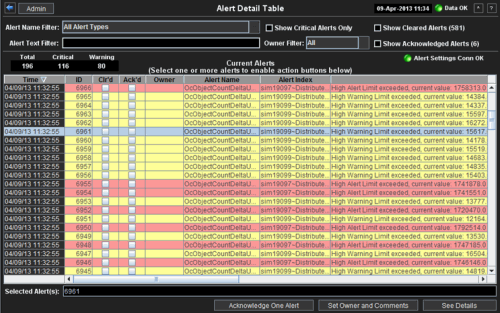
Alert Detail Table display
presents
alert states for all alerts that have
occurred in the OCM system (all
Owners and all Areas). Use this time-ordered tabular
list to track, manage
and assign alerts. Enable and
disable alerts in the
Alert Administration
display.
- Alert Detail
Table
Table provides alert details in a time-ordered list of all alerts that have occurred. Manage active alerts, add comments and acknowledge alerts.
NOTE: Click the
![]() button to view
the current display in a new window.
button to view
the current display in a new window.
Alert Detail Table
Use this
display to track and manage
all alerts that have occurred in the OCM system, add comments or assign Owners to alerts.
Alerts are color-coded to visually indicate
the alert status:
| Red | Critical state: The critical threshold for this alert has been exceeded. |
| Yellow | Warning state: The warning threshold for this alert has been exceeded. |

| Alert Name Filter | Select an
alert type (also
referred to as the alert name) to show in the table, or select * (asterisk)
to show all alert types. The table lists all sources (which are stated in
the Alert Index column) that exceeded the warning threshold for the
selected alert type.
Because a single alert type is applied to multiple sources (nodes or caches), if you select the OcAvailableMemoryLowNodeSpike alert type, for example, multiple nodes might be shown (if they exceeded the warning threshold for that alert type). And if you select the OcCapacityLimitCache alert type, multiple caches might be shown (if they exceeded the warning threshold for that alert type). If you select * (asterisk), all alert types are shown for all nodes and caches that exceeded the warning threshold for any alert type. By default, all alert types are shown. |
|||
| Alert Text Filter | This
filter uses Regex filtering. Enter the (case-sensitive) string to search in
the Current Alerts table Alert Text column, then press
Enter. To remove the filter, delete the text and press Enter. For example, to display only Warning alerts, enter *Warning*, then press Enter. The Current Alerts table then displays only alerts with Warning in the Alert Text string. |
|||
| Show Critical Alerts Only | Check to show only critical alerts in the table (and no warning alerts). Critical alerts have a severity level of 2. By default, critical and warning alerts are shown. | |||
| Show Cleared | Check to show cleared alerts. An alert is considered cleared when the source for the alert (node or cache) returns to below the alert threshold. By default, warning and critical alerts are shown. | |||
|
Show Acknowledged
|
Check to show acknowledged alerts. Acknowledged alerts were manually acknowledged. Acknowledged alerts are automatically removed from the Current Alerts table. By default, warning and critical alerts are shown. | |||
| Owner Filter | Select the alert Owner to show alerts for in the table. | |||
| All | Shows alerts for all Owners in the table: Not Owned and Owned By Me alerts. | |||
| Not Owned | Shows only alerts without Owners in the table. | |||
| Owned By Me | Shows only alerts for the current user in the table. | |||
| Alert Settings Conn OK | ||||
| Red | The Alert Server is disconnected. | |||
| Green | The Alert Server is connected. | |||
| Total | The total number of alerts currently listed in the table. | |||
| Critical | Check to show alerts in the table that are currently in a critical state. Also shows the total number of alerts that are currently in a critical state and currently listed in the table. | |||
| Warning | Check to show alerts in the table that are currently in a warning state. Also shows the total number of alerts that are currently in a warning state and currently listed in the table. | |||
| Current Alerts | The
Current Alerts table lists all alerts for
all sources (nodes and caches) that exceeded an alert threshold. Filter
the alert types shown using the Show Type drop-down list. Filter the alert
states shown by selecting Show Critical Alerts Only, Show Cleared or
Show
Acknowledged. Sort the data by column using the
|
|||
| Time | The date and time the alert was issued. | |||
| Cleared | When checked, the alert cleared. An alert is cleared when the source for the alert (a node or cache) returns to below the specified alert threshold. To include cleared alerts in the table, select Show Cleared. | |||
| Acknowledged | When checked, the alert was manually acknowledged. Acknowledged alerts are automatically removed from the Current Alerts table. To include cleared alerts in the table, select Show Acknowledged. | |||
| Alert Name | The alert type. Alert types contain alert threshold definitions. A single alert type applies to all nodes or caches in the cluster. For example, the OcAvailableMemoryLowNodeSpike alert type applies to multiple nodes, and the OcCapacityLimitCache alert type applies to multiple caches. | |||
| Alert Index | The Oracle Coherence source from which the alert originated. If the alert is a cluster alert the Alert Index is the the cluster name. Otherwise, the Alert Index is the cluster name followed by the node or cache name. | |||
| Alert Text | Descriptive information about the alert. | |||
| ID | Unique string identifier for the alert. | |||
| Owner | When checked, the alert was closed by a user. To see the Closed table column, select the Closed checkbox (on the lower left). | |||
| Severity |
The severity level of the alert.
0: The alert
limit has not been exceeded therefore the alert is not activated. |
|||
| Source | The name of the Data Server reporting the alert. | |||
| Acknowledge | Select one or more alerts from the Current Alerts table and click Acknowledge One Alert (or Acknowledge Multiple Alerts if multiple alerts are selected). Acknowledged alerts are removed from the Current Alerts table. | |||
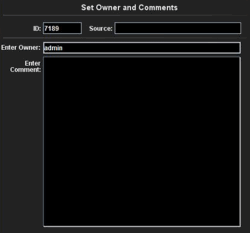
| Set Owner and Comments |
Select one or more alerts from the Current
Alerts table,
then click Set
Owner and Comments to open the Set
Owner and Comments dialog and enter
comments or change alert owner.
|
|||
| ID | Alert IDs, separated by semicolons (;), for the alerts selected from the Current Alerts table. | |||
| Source |
The name of the Data Server reporting the alert. |
|||
| Enter Owner | Enter the name of the owner for one or more alerts, click Set Owner of One Alert to assign the Owner, then click Close. By default, this field displays the current user name. | |||
| Enter Comment | Enter a comment for one or more alerts, click Add Comment on One Alert to apply the Comment, then click Close. By default, this field displays previously entered comments. The text appears in the Comments field for the alert. | |||
| Set Owner of One Alert | Applies the name of the alert owner in the Enter Owner field. | |||
| Add Comment on One Alert | Applies the comment in the Enter Comment field. | |||
| Clear Comments on One Alert | Removes all comments for one or more alerts. | |||
| Close | Closes the dialog. | |||
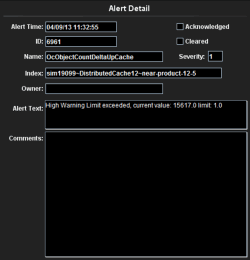
| See Details |
Select an alert from the Current Alerts
table,
then click
See
Details to open the Alert Detail window and view alert
details.
|
|||
|
RTView contains components licensed under the Apache
License Version 2.0. |
|
Treemap Algorithms v1.0 is used without
modifications and licensed by MPL Version 1.1. Copyright © 2001 University of
Maryland, College Park, MD |
|
Datejs is licensed under MIT. Copyright © Coolite Inc. |
|
jQuery is
licensed under MIT. Copyright © John Resig, |
|
JCalendar 1.3.2 is licensed under LGPL.
Copyright © Kai Toedter. |
|
jQuery is licensed under MIT. Copyright (c) 2009 John
Resig, http://jquery.com/ JCalendar 1.3.2 is licensed under LGPL.
Copyright © Kai Toedter. |
|
JMS, JMX and Java are trademarks or registered trademarks
of Sun Microsystems, Inc. in the United States and other countries. They are
mentioned in this document for identification purposes only. |
|
SL, SL-GMS, GMS, RTView, SL Corporation, and
the SL logo are trademarks or registered trademarks of Sherrill-Lubinski
Corporation in the United States and other countries. Copyright © 1998-2013
Sherrill-Lubinski Corporation. All Rights Reserved. |


