|
|
Oracle Coherence Monitor
User Guide |
|
|
Using the Monitor
- Administration
These displays allow you
to manage your OCM metrics, alerts and caches. Some of these displays may be
read-only depending on your login.
-
Alert
Administration
Set thresholds for and enable alerts that have been defined in the system. -
Metrics Administration
Administer and configure data collection and processing options. -
RTView Cache Tables
Permits user to modify cache parameters.
NOTE: Click the
![]() button to view
the current display in a new window.
button to view
the current display in a new window.
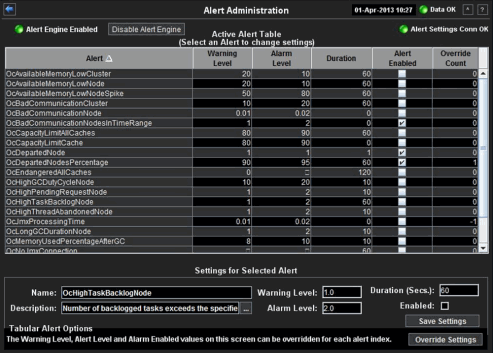
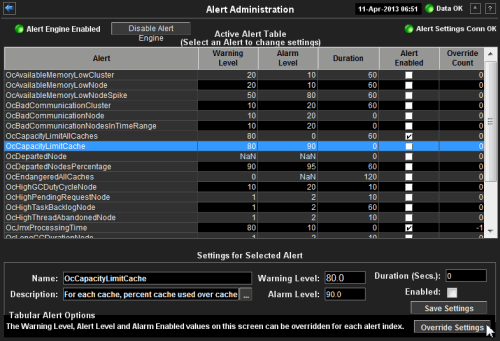
Alert Administration
Set global or override alert thresholds.
Alert settings are global by default.
Use this display
to configure alert thresholds, and enable or disable alerts.
Override settings allow for individual configuration for each cluster.
Alerting is enabled by default. This display
is read-only unless you are logged in as admin or
super. For alert descriptions, see
OCM Alert Definitions.
Global
To set a global alert, select an alert from the Active
Alert Table. The name of the selected alert populates the Settings for
Selected Alert Name field. Edit Settings
for Selected Alert and click Save Settings when
finished.
Override
Setting override alerts
allows you to
override the global settings of an alert. For example you might have a general
alert threshold setting which applies to most monitored clusters, yet you need
to override that setting for a particular cluster because of its usage patterns. For information about setting
override alerts, see
Tabular Alert Administration.
For alert descriptions, see OCM Alert Definitions.
Alert Types
To configure thresholds or enable/disable alerts, you configure the Alert
Type (also referred to as the Alert Name) such as
OcAvailableMemoryLowNodeSpike.
A single alert type is
applied to multiple sources--nodes or caches--depending on the kind of alert
type. Alert types
issue alerts for any
source in the cluster that exceeds the specified thresholds for the alert type.
Each alert issued contains a unique identifier for the source that indicates the
alert origin.
For example, the OcAvailableMemoryLowNodeSpike alert type applies to all nodes in the cluster, therefore the OcAvailableMemoryLowNodeSpike threshold settings are the same for all nodes in the cluster. When the OcAvailableMemoryLowNodeSpike alert type is disabled, no OcAvailableMemoryLowNodeSpike alerts are issued for any node in the cluster. When the OcAvailableMemoryLowNodeSpike alert type is enabled, OcAvailableMemoryLowNodeSpike alerts are issued for any node in the cluster that exceeds a threshold specified for the OcAvailableMemoryLowNodeSpike alert type. Each alert issued by the OcAvailableMemoryLowNodeSpike alert type contains the unique identifier for the source node.
Likewise, the OcEndangeredAllCaches alert type applies to all caches in the cluster, therefore the OcEndangeredAllCachesthreshold settings are the same for all caches in the cluster. When the OcEndangeredAllCaches alert type is disabled, no OcEndangeredAllCaches alerts are issued for any cache in the cluster. When the OcEndangeredAllCaches alert type is enabled, OcEndangeredAllCaches alerts are issued for any cache in the cluster that exceeds a threshold specified for the OcEndangeredAllCaches alert type. Each issued alert contains the unique identifier for the source cache.
| Alert Settings | The Alert Server connection state. | |
| Red | The Alert Server is not connected. | |
| Green | The Alert Server is connected. | |
| Active Alert Table | This table describes the global settings for all alerts on the system. Select an alert. The name of the selected alert populates the Settings for Selected Alert Name field (in the lower panel). Edit Settings for Selected Alert fields and click Save Settings when finished. | |
| Alert | The name of the alert. For alert descriptions, see OCM Alert Definitions. | |
| Warning Level | The global warning threshold for the selected alert. When the specified value is exceeded a warning is executed. | |
| Alarm Level | The global alarm threshold for the selected alert. When the specified value is exceeded an alarm is executed. | |
| Duration | The amount of time (in seconds) that the value must be above the specified Warning Level or Alarm Level threshold before an alert is executed. 0 is for immediate execution. | |
| Alert Enabled | When checked, the alert is enabled globally. | |
| Override Count |
The
number of times thresholds for this alert
have been defined individually in
the
Tabular Alert Administration display. NOTE: The OcJmxProcessingTime alert does not support overrides. For that alert the Override Count is displayed as -1. |
|
| Settings for Selected Alert | To
view or edit Global settings, select an alert from the Active Alert Table.
Edit Settings
for Selected Alert and click Save Settings when
finished. NOTE: To set override alerts, click on Override Settings to open the Tabular Alert Administration display. |
|
| Name | The name of the alert selected in the Active Alert Table. | |
| Description |
Description of the selected alert. NOTE: Click
on the
|
|
| Warning Level | Set
the Global
warning threshold for the selected alert. When
the specified value is exceeded a warning is executed. To set the warning to
occur sooner, reduce the Warning Level value. To set the warning to
occur later, increase the Warning Level value.
NOTE: For low value-based alerts, to set the warning to occur sooner, increase the Warning Level value. To set the warning to occur later, reduce the Warning Level value. |
|
| Alarm Level |
Set the
Global alarm threshold for the selected
alert. When the specified value is exceeded an alarm is executed. To set the
alarm to occur sooner, reduce the Alarm Level value. To set the
warning to occur later, increase the Alarm Level value.
NOTE: For low value-based alerts, to set the alarm to occur sooner, increase the Alarm Level value. To set the alarm to occur later, reduce the Alarm Level value. |
|
| Duration | Set the amount of time (in seconds) that the value must be above the specified Warning Level or Alarm Level threshold before an alert is executed. 0 is for immediate execution. This setting is global. | |
| Enabled | Check to enable alert globally. | |
| Save Settings | Click to apply alert settings. | |
| Override Settings | Click to open the Tabular Alert Administration display to set override alerts on the selected alert. | |
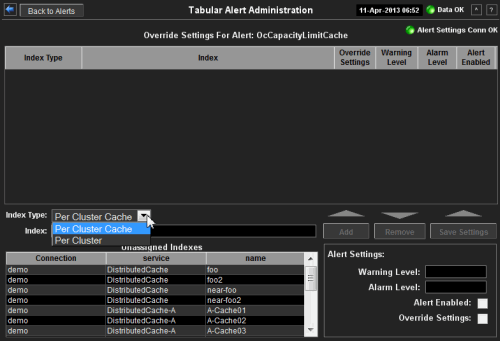
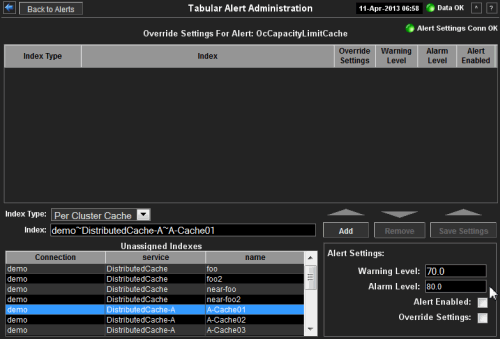
Tabular Alert Administration
Set override alerts (override global alert settings). This display opens when
you select an alert in the
Alert Administration display and then select
Override Settings.
For instructions
setting thresholds for individual alerts, see
Setting Override Alerts.
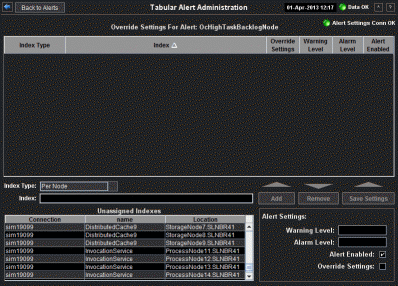
| Alert Settings Conn OK | The connection state. | |
| Red | No servers are found. | |
| Green | One or more servers are delivering data. | |
| Override Settings For Alert:(name) | This table lists and describes alerts that have override settings for the selected alert. Select a row to edit alert thresholds. The selected item appears in the Index field. Edit settings in the Alert Settings fields, then click Save Settings. For instructions setting thresholds for individual alerts, see Setting Override Alerts. | |
| Index Type | Select the type of alert index to show in the Values table. Options in this drop-down menu are populated by the type of alert selected. | |
| Index | The value of the index column. | |
| Warning Level | Set the warning
threshold for the selected
override alert.
When the specified value is exceeded a warning is executed. To set the
warning to occur sooner, reduce the Warning Level value. To set the
warning to occur later, increase the Warning Level value.
<NOTE: For low value-based alerts, to set the warning to occur sooner, increase the Warning Level value. To set the warning to occur later, reduce the Warning Level value. |
|
| Alarm Level |
Set the alarm threshold for the selected
override alert. When the
specified value is exceeded an alarm is executed. To set the alarm to occur
sooner, reduce the
Alarm Level value. To set the warning to occur
later, increase the
Alarm Level value.
NOTE: For low value-based alerts, to set the alarm to occur sooner, increase the Alarm Level value. To set the alarm to occur later, reduce the Alarm Level value. |
|
| Alert Enabled | When checked, the alert is enabled. | |
|
Override Settings
|
When checked, the settings specified here override global alert settings
specified in the
Alert
Administration display. This allows you to enable or disable an
overridden alert for specific clusters, nodes or caches, regardless of the
setting of the global alert.
When Override Settings is checked, the value of the Alert Enabled checkbox on this display takes precedence over the Alert Enabled setting on the main Alert Administration display for the selected overridden alert. The Override Settings checkbox ONLY applies to the Alert Enabled checkbox directly above it AND tells the alert engine to ignore the Alert Administration display Alert Enabled checkbox. This provides for four possible scenarios: 1. If the Override Settings checkbox is CHECKED and
the Alert Enabled checkbox is CHECKED, the overridden alert is
ENABLED. (The
Alert
Administration display Alert Enabled
checkbox is ignored.) For instructions
setting thresholds for individual alerts, see
Setting Override Alerts. |
|
| Index Type | Select the index type. The index type specifies how to apply alert settings. For example, Per Cluster allows overriding individual clusters, and Per Node allows for overriding specific nodes on specific clusters. Index types vary depending on the selected alert. | |
| Index | The selected index column to be edited. This field is populated by the selection made in the Unassigned Indexes table. | |
| Unassigned Indexes | This table lists all possible indexes corresponding to the Index Type chosen in the drop-down list. Select a row to apply individual alert thresholds. The selected item appears in the Index field. Edit settings in the Alert Settings fields, then click Add. | |
| Add | Click to add changes made in Alert Settings, then click OK to confirm. | |
| Remove | Click to remove an alert selected in the Index Alert Settings table, then click OK to confirm. | |
| Save Settings | Click to save changes made to alert settings. | |
| Alert Settings | Select a topic, server or queue from the Unassigned Indexes table and edit the following settings. For instructions setting thresholds for individual alerts, see Setting Override Alerts. | |
| Warning Level |
Set
the warning threshold for the selected alert. When the specified value is
exceeded a warning is executed. To set the warning to occur sooner, reduce
the Warning Level value. To set the warning to occur later, increase
the Warning Level value.
NOTE: For low value-based alerts, to set the warning to occur sooner, increase the Warning Level value. To set the warning to occur later, reduce the Warning Level value. Click Save Settings to save settings. |
|
| Alarm Level |
Set
the alarm threshold for the selected alert. When the specified value is
exceeded an alarm is executed. To set the alarm to occur sooner, reduce the
Alarm Level value. To set the warning to occur later, increase the
Alarm Level value.
NOTE: For low value-based alerts, to set the alarm to occur sooner, increase the Alarm Level value. To set the alarm to occur later, reduce the Alarm Level value. Click Save Settings to save settings. |
|
| Alert Enabled | Check to enable the alert, then click Save Settings. | |
| Override Settings | Check to enable override global setting, then click Save Settings. | |
This section provides step-by-step instructions for creating and editing override alerts, including:
To Create Override Alerts
1. In the Alert
Administration display, select an
alert in the
Active Alert Table
and click
Override Settings.
The Tabular Alert Administration display opens.
2. In the Tabular Alert Administration display, from the Index Type drop-down menu, select the Index type (options are populated by the type of alert you previously selected). For example, select Per Node, Per Cluster or Per Cache (depending on the selected alert).
3. In the Unassigned Indexes table, select the index to apply to the alert.

4. In the Alert Settings panel, set the Warning Level and Alarm Level.
5. In the Alert Settings panel, set the following as appropriate:
| To turn on the alert for this index with the given thresholds (this option might be used to test an alert on a development system, rather than production system): | ||||
| Alert Enabled | Select this option. | |||
| Override Settings | Select this option. | |||
| To turn off the alert for only this index so that global alert thresholds no longer apply to this index (this option might be used while performing maintenance on a cache): | ||||
| Alert Enabled | Deselect this option. | |||
| Override Settings | Select this option. | |||
| To revert to global settings and retain a placeholder for this override alert (this option might be used so that you can do either of the previous options again in the future): | ||||
| Alert Enabled | Deselect this option. | |||
| Override Settings | Deselect this option. | |||
| (or click Remove this indexed alert if it is never to be used again) | ||||
6. Click Add.

7. Click Yes in the Confirm dialog.
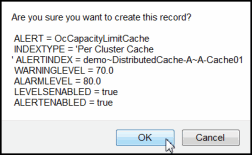
After a few moments the alert appears in the Override Settings For Alert (name) table.
To Edit Override Alerts
1. In the Override Settings For Alert (name) table, select the row
with the override.
2. In the Alert Settings panel, set the Warning Level and Alarm Level.
3. In the Alert Settings panel, set the following as appropriate:
| To turn on the alert for this index with the given thresholds (this option might be used to test an alert on a development system, rather than production system): | ||||
| Alert Enabled | Select this option. | |||
| Override Settings | Select this option. | |||
| To turn off the alert for only this index so that global alert thresholds no longer apply to this index (this option might be used while performing maintenance on a cache): | ||||
| Alert Enabled | Deselect this option. | |||
| Override Settings | Select this option. | |||
| To revert to global settings and retain a placeholder for this override alert (this option might be used so that you can do either of the previous options again in the future): | ||||
| Alert Enabled | Deselect this option. | |||
| Override Settings | Deselect this option. | |||
| (or click Remove this indexed alert if it is never to be used again) | ||||
4. Click Save Settings, then Yes in the Confirm dialog.
To Remove Override Alerts
1. In the Override Settings For Alert (name) table, select the row
with the override.
2. Click Remove, then Yes in the Confirm dialog.
The following OCM alerts are visible in the Active Alert Table.
| OcAvailableMemoryLowCluster | A single alert is executed if the average percent memory used over max memory of all nodes in the cluster exceeds the specified thresholds. |
| OcAvailableMemoryLowNode | For each node in the cluster, an alert is executed if the percent memory used over max memory available for that node exceeds the specified thresholds. |
| OcAvailableMemoryLowNodeSpike | For
each node in the cluster, an alert is executed if the percent memory used
exceeds the specified threshold for the percent above average memory used in
the previous 24 hours. For example, if the threshold is set to 50% of total
memory used, and the average memory consumption on a particular node for the
previous 24 hours is 40%, an alert will be executed if current memory usage
exceeds 60% of the total. NOTE: The 24 hour time span (86400 seconds) is controlled by the $AVERAGE_MEMORY_TIME_WINDOW substitution. The warning
default setting is
115 (percent) of the previous 24 hours and the alarm
default setting is 125 (percent) of the previous 24 hours. |
| OcBadCommunicationCluster | A single alert is executed if the average communication failure rate of all nodes in the cluster drops below the specified thresholds. |
| OcBadCommunicationNode | For each node in the cluster, an alert is executed if the communication failure rate for that node drops below the specified thresholds. |
| OcBadCommunicationNodesInTimeRange |
Executes a single warning and a single
alert if the percentage of nodes in a cluster meets or exceeds the specified threshold for the
BadCommunicationNode alert within a time range specified.
To specify the time range, modify the
$BAD_COMMUNICATION_NODES_TIME_RANGE The default time range setting is 5 minutes (300 seconds), the warning default setting is 40 (percent) and the alarm default setting is 50 (percent). By default the alert is enabled. |
| OcCacheQueueSizeHigh | A single alert is executed if the CacheQueueSize for all nodes in the cluster exceeds the specified thresholds. By default the alert is disabled with the following default settings: Warning is 100 (seconds), Alarm is 200 (seconds) and Duration is 60 (seconds). |
| OcCapacityLimitAllCaches |
An
alert is executed if the percent cache used over cache capacity for any
cache in the cluster exceeds the specified thresholds. There is one
highWarning and one highAlert threshold. For example, if there are 3 caches
in a cluster, where:
cache1 val = 95 and the CapacityLimitAllCaches highWarning is 80 and highAlert is 90, one high alert is executed. |
| OcCapacityLimitCache |
This
tabular alert
executes an alert for each cache in the cluster where the percent
cache used over cache capacity exceeds the specified thresholds. There
is one highWarning and one highAlert threshold per cache. For
example, if there are 3 caches in a cluster, where:
cache1 val = 95 and the CapacityLimitAllCaches highWarning is 80 and highAlert is 90, two high alerts are executed, one for cache1 and another for cache2. |
| OcDepartedNode | For each node in the cluster, an alert is executed if the time a node is absent from the cluster exceeds the specified thresholds. When the departed node rejoins the cluster, the alert is cleared. |
| OcDepartedNodesPercentage | This
scalar alert executes a single warning and a single alert if the percentage
of nodes departed from the cluster exceeds the specified threshold within the specified time period. The percentage is measured against the
total number of nodes in the cluster, including both running and departed
nodes. The time period is set in the OPTIONS.ini file using the $NODES_DEPARTED_TIME_WINDOW substitution. The time period can also be overridden using the command line interface. For example, the following sets a time window of 300 seconds: -sub:$NODES_DEPARTED_TIME_WINDOW:300 The time period default setting is 600 (10 minutes), the warning default setting is 90 (percent) and the alarm default setting is 95 (percent). By default the alert is disabled. |
| OcEndangeredAllCaches | This alert is executed if the StatusHA for the cache service is NODE_SAFE (high warning) or ENDANGERED (high alert). |
| OcEndangeredCache | For each node in the cluster, an alert is executed if the StatusHA value is ENDANGERED. By default the alert is disabled. |
| OcHighGCDutyCycleNode | This
scalar alert executes a single warning and a single alert if a node exceeds
the specified duty cycle threshold (the percent of time spent in Garbage
Collection). By default the alert is enabled with the following default settings: Warning is 10 (percent), Alarm is 20 (percent) and Duration is 10 seconds. |
| OcHighPendingRequestNode |
A single alert is
executed if the RequestPendingCount
amount exceeds the specified threshold. This alert allows for setting the
warning level, alarm level and duration.
By default the alert is disabled. |
| OcHighTaskBacklogNode | A
single warning and a single alert are executed if the number of backlogged
tasks exceeds the specified user threshold. This alert allows for setting
the warning level, alarm level and duration.
The default setting executes a warning if the number of backlogged tasks exceeds 10, and executes an alert if the number of backlogged tasks exceeds 20. By default the alert is disabled. |
| OcHighThreadAbandonedNode | A
single alert is executed if the Coherence Thread Abandoned Count amount
exceeds the specified threshold. This alert allows for setting the warning
level, alarm level and duration. The default setting executes a warning and an alert if the Thread Abandoned Count amount exceeds 0. The default duration setting is 60. By default the alert is enabled. |
| OcJmxProcessingTime | This alert is executed if
the sum of time for JMX queries and all data processing functions exceeds
the specified
threshold for the jmxsampleperiod property. By default the alert is disabled with the following default settings: Warning
is 80 (percent), Alarm is 90 (percent) and Duration is 0
(seconds).
NOTE: The OcJmxProcessingTime alert does not support overrides. For that alert the Override Count is displayed as -1. |
|
OcLongGCDurationNode
|
A single warning and a single
alert are executed if any of the last
garbage collection times exceed the specified duration.
The default setting executes a warning if the duration exceeds 1 second, and executes an alert if the duration exceeds 2 seconds. It is possible for GC times to exceed the specified duration and NOT execute an alert. This is possible if it occurs between the alert duration time and an alert condition time. For example, if your alert duration is 60 seconds, and there is also an alert condition set at 27 seconds into that 60 seconds, the following scenarios could occur (where XX:XX:XX is Hours:Minutes:Seconds):
Scenario
1: 12:00:27 GC amount exceeds the specified threshold. Alert ignored for now. 12:01:00 GC amount is below the specified threshold. No alert executed.
Scenario
2: 12:00:27 GC amount exceeds the specified threshold. Alert ignored for now. 12:01:00 GC amount remains above the specified threshold. Alert executed. By default the alert is enabled. |
| OcLowClientNodeCount |
This alert executes if the total
number of nodes being monitored, including storage enabled nodes, client
nodes, and management (JMX) nodes, is below
the
specified
threshold. When the count returns to above
to above the threshold
(departed nodes
rejoin the cluster), the alert is cleared.
By default the alert is disabled. |
| OcLowStorageNodeCount |
This alert executes if the total
number of storage
nodes in the
cluster is below the specified threshold. When the count returns to
above to above the threshold (departed nodes
rejoin the cluster), the alert is cleared.
By default the alert is disabled. |
| OcLowTotalNodeCount |
This alert executes if the total
number of client nodes being monitored is below the specified
threshold. When the count returns to above to above the threshold (departed nodes
rejoin the cluster), the alert is cleared.
By default the alert is disabled. |
| OcMemoryUsedPercentageAfterGC | This alert is executed if the percent of memory used on a node after garbage collection exceeds the specified threshold. By default the alert is disabled with the following default settings: Warning is 70 (percent), Alarm is 80 (percent) and Duration is 30 (seconds). |
| OcNodeSafeCacheTwo | For each node in the cluster, an alert is executed if the StatusHA value is NODE-SAFE. By default the alert is disabled. |
| OcNoJmxConnection | This alert is executed if a JMX connection remains disconnected after a specified duration of time. The default duration of time is 60 seconds. By default, this alert is enabled. |
|
OcObjectCountDeltaUpCache
|
This
tabular alert
executes
a single warning and a single
alert for each cache in the cluster if the cache
object count delta increases and reaches the specified threshold. In
addition to setting the warning and alarm levels, this
alert also allows for setting the duration
for each cache. When this alert is selected in the Active Alert Table, the Per Cache Alert Setting box is displayed (rather than the scalar alert box). By default the alert is disabled. |
| OcObjectCountDeltaDownCache |
This
tabular alert
executes a single warning and a single
alert for each cache in the cluster where
the cache object count delta decreases and
reaches the specified threshold. In addition to setting the warning and
alarm levels, this
alert also allows for setting the duration
for each cache. When this alert is selected in the Active Alert Table, the Per Cache Alert Setting box is displayed (rather than the scalar alert box). By default the alert is disabled. |
| OcSendQueueSize | For each node in the cluster, an alert is executed if the Send Queue for that node exceeds the specified thresholds. By default the alert is disabled with the following default settings: Warning is 100 (seconds), Alarm is 200 (seconds) and Duration is 60 (seconds). |
| OcStoreFailure | This alert is executed if the number of StoreFailures exceeds the specified threshold. By default the alert is disabled with the following default settings: Warning is 1 (second), Alarm is 10 (seconds) and Duration is 30 (seconds). |
Metrics Administration
Verify when metrics were last queried by the OC Monitor. The data in this display is predominantly used for debugging by SL Technical Support.
| RTView Internal Statistics | Select to open the RTView MBeans for Status and Timing Info display (in a separate window). | ||
| RTView JMX Query Statistics | This table lists all JMX data objects. | ||
| Admin Query Key | The dsString used for the data attachment to this data object. | ||
| Count | The number of listeners for this data object. For example, graphical objects and function arguments. | ||
| Filter Objects | The number of filtered data objects in this data object. | ||
| hasParent | True if the data object is a filtered data object. | ||
| Last Exec Time | The last time we queried for the metric associated with this data object. | ||
| Total JMX Time | |||
| Total JMX Time | |||
| Time Range | Select a time range from the drop down menu varying from 2 Minutes to Last 7 Days, or display All Data. | ||
| Trend Graph | Traces the cumulative and maximum execution times, in seconds, for all Admin Query Keys in the table. | ||
| Max JMX Time | The maximum execution time, in seconds, for all Admin Query Keys in the table. | ||
| Total JMX Time | The cumulative execution time, in seconds, for all Admin Query Keys in the table. | ||
RTView Cache Tables
View data that RTView is capturing and maintaining. Drill down and view details of RTView Cache Tables. Use this data for debugging. This display is typically used for troubleshooting with SL Technical Support.
| RTView Cache Tables |
This table lists and describes all defined RTView Cache Tables
for your system. Cache tables
gather Monitor data and are the source that populate the Monitor displays.
Each row is a cache table. Click a row to view more detail (in the table that opens below this one). |
||
| Max Rows | The specified maximum number of rows for the cache table. | ||
| History Table | Select to include all defined history tables in the cache tables list. | ||
| CacheTable | The name of the cache table. | ||
| TableType | The type of cache table. | ||
| current | This table is a current table which shows the current values for each index. | ||
| current_condensed | This table is a current table with primary compaction configured. | ||
| history | This table is a history table. | ||
| history_condensed | This table is a history table with primary compaction configured. | ||
| history_combo | This table is a history table with primary compaction configured, and which is also configured to store rows of recent raw data followed by rows of older condensed data. | ||
| Rows | The number of rows currently in the table. | ||
| Columns | The number of columns currently in the table. | ||
| Memory | The amount of space, in bytes, used by the table. | ||
|
RTView contains components licensed under the Apache
License Version 2.0. |
|
Treemap Algorithms v1.0 is used without
modifications and licensed by MPL Version 1.1. Copyright © 2001 University of
Maryland, College Park, MD |
|
Datejs is licensed under MIT. Copyright © Coolite Inc. |
|
jQuery is
licensed under MIT. Copyright © John Resig, |
|
JCalendar 1.3.2 is licensed under LGPL.
Copyright © Kai Toedter. |
|
jQuery is licensed under MIT. Copyright (c) 2009 John
Resig, http://jquery.com/ JCalendar 1.3.2 is licensed under LGPL.
Copyright © Kai Toedter. |
|
JMS, JMX and Java are trademarks or registered trademarks
of Sun Microsystems, Inc. in the United States and other countries. They are
mentioned in this document for identification purposes only. |
|
SL, SL-GMS, GMS, RTView, SL Corporation, and
the SL logo are trademarks or registered trademarks of Sherrill-Lubinski
Corporation in the United States and other countries. Copyright © 1998-2013
Sherrill-Lubinski Corporation. All Rights Reserved. |