|
|
Oracle Coherence Monitor
User Guide |
|
|
Using the Monitor
- Single Cache
Single Cache
displays present detailed cache performance
metrics for a single cache. Use the
Single Cache
displays to perform cache utilization analysis.
The data in these displays
can be sorted and
viewed by service or cache.
-
Single Cache Summary
Perform low level utilization analysis on a single cache. -
Size Trends
Trend chart displays size/capacity metrics. -
Activity Trends
Trend chart displays activity metrics. -
Cache
Detail
Table showing current detailed cache statistics by node. -
Storage Manager Detail
Table showing store manager metrics. -
Node/Group Distribution
Bar chart displays metrics showing distribution across cluster nodes or groups. -
Front/Back Analysis
Displays metrics for the front and back tiers of a selected cache.
NOTE: Click the
![]() button to view the
current display in a new window.
button to view the
current display in a new window.
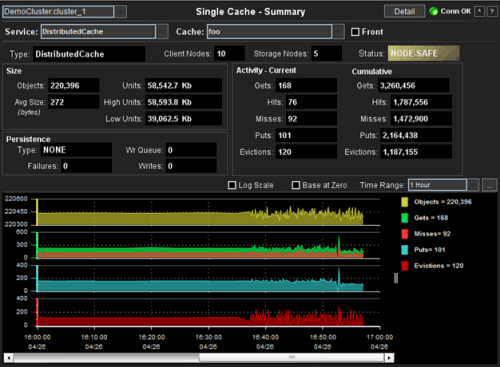
Use Single Cache - Summary display to do low level cache utilization analysis. Check the metrics for Size, Evictions and Misses to determine whether more capacity is needed. Cache Summary provides summary information about an individual cache.
| Cluster | Select a cluster from the drop-down menu. | ||
| Service | Select a service to display. | ||
| Cache | Select a cache. Click the Detail button to get information specific to the selected cache. | ||
| Front | Select for front tier, deselect for back tier. | ||
| Type | The type identifier string from the ServiceMBean (ReplicatedCache, DistributedCache, etc.). | ||
| Client Nodes | The number of cluster nodes that do not have storage enabled. | ||
| Storage Nodes | The number of cluster nodes that are storage enabled. | ||
| Status | The High Availability Status for the selected service. | ||
| MACHINE-SAFE | If a machine for the service goes offline the data stored on the machine remains available in the cluster (no data loss). | ||
| NODE-SAFE | If a node for the service goes offline (or is taken offline using kill-9) data stored on the node remains available in the cluster (no data loss). | ||
| ENDANGERED | If a node for the service goes offline the data stored on the node is potentially unavailable in the cluster (potential data loss). | ||
|
Size NOTE: Units indicates memory usage for the back tier and number of objects for the front tier. |
Objects | The number of objects in the selected cache. The value is the total across all storage nodes. | |
| Avg Size | The average size of objects in the selected cache (in bytes if it is the back tier). | ||
| Units | The memory usage if back tier, or number of objects if front tier. The value is the total across all storage nodes. | ||
| High Units | Maximum memory, or number of objects allowed before Coherence starts to evict objects from the selected cache. The value is the total across all storage nodes. | ||
| Low Units | The level of memory, or number of objects to which Coherence will reduce the cache during the eviction process. The value is the total across all storage nodes. | ||
| Persistence | Type | The persistence type for the cache. Possible values include: NONE, READ-ONLY, WRITE-THROUGH, and WRITE-BEHIND. | |
| Failures | The number of write (cache store) failures, including load, store and erase operations. NOTE: This value is -1 if the persistence type is NONE. | ||
| Wr Queue | The size of the queue, in kilobytes, that holds data scheduled to be written to the cache store. | ||
| Writes | The number of objects (cache entries) written to the cache store. | ||
| Activity | Current | Within the most recent JMX retrieval period (default 10 seconds). | |
| Cumulative | Since the service was started for the selected cache, or since statistics were reset. | ||
| Gets | The number of requests for data from this cache. | ||
| Hits | The number of successful gets. | ||
| Misses | The number of failed gets. | ||
| Puts | The number of data stores into this cache. | ||
| Evictions | The number of objects removed to make room for other objects. | ||
| Log Scale | Enable to use a logarithmic scale for the Y axis. Use Log Scale to see usage correlations for data with a wide range of values. For example, if a minority of your data is on a scale of tens, and a majority of your data is on a scale of thousands, the minority of your data is typically not visible in non-log scale graphs. Log Scale makes data on both scales visible by applying logarithmic values rather than actual values to the data. | ||
| Base at Zero | Use zero for the Y axis minimum for all graphs. | ||
| Time Range |
Select a time range or All Data from the
drop-down menu. By default, the ending period for displayed data is the
current time. To specify a time range: 1. Click the 2. Change the time range end point by
clicking the 3. Click Apply. The navigation arrows
4. Use the navigation arrows |
||
| Trend Graphs | Objects | The number of objects in the selected cache. The value is the total across all storage nodes. | |
| Gets | Total requests for data from this cache. | ||
| Misses | Total number of failed gets. | ||
| Puts | Total data stores into this cache. | ||
| Evictions | Number of objects removed from the cache to make room for other objects. | ||
Size Trends
Size
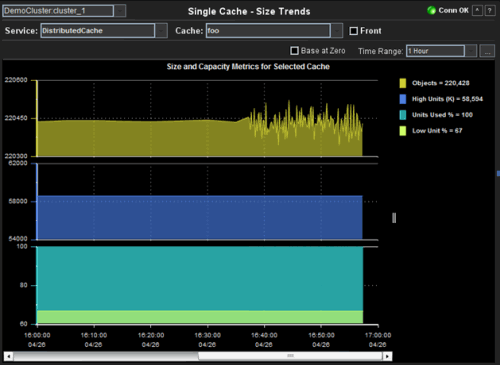
Trends provides a method of viewing the degree to which available cache size
has been consumed. Under normal operations the cache will evict and reload
objects into the cache. This will be displayed as a significant drop in
the Units Used trend. However, if these drops are too frequent the
application might not be performing optimally. Adding capacity and
examining or modifying application usage patterns might be required. The data
displayed here is a sum of all storage nodes in the cache filtered by the
selected service and cache.
Try changing the High Units setting in the Cache Administration page to something like 100,000 and then see the effect on these trend charts.
| Cluster | Select a cluster from the drop-down menu. |
| Service | Select a service to display. |
| Cache | Select a cache. |
| Front | Select for front tier, deselect for back tier. |
| Base at Zero | Use zero for the Y axis minimum for all graphs. |
| Time Range |
Select a time range or All Data from the
drop-down menu. By default, the ending period for displayed data is the
current time. To specify a time range: 1. Click the 2. Change the time range end point by
clicking the 3. Click Apply. The navigation arrows
4. Use the navigation arrows |
Activity Trends
Activity
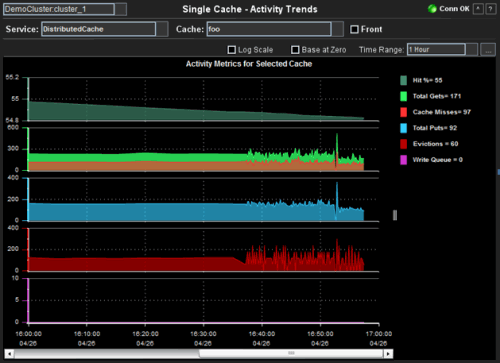
Trends provides a set of trend graphs that show the magnitude of the cache usage and the effectiveness of the
implementation. If the overall effectiveness is not as desired,
increasing capacity, pre-loading the cache and increasing the eviction time
may result in improvements in cache hits. The data displayed here is a sum of
all storage nodes in the cache filtered by the selected service and cache.
| Cluster | Select a cluster from the drop-down menu. | |
| Service | Select a service to display. | |
| Cache | Select a cache. | |
| Front | Select for front tier, deselect for back tier. | |
| Log Scale | Enable to use a logarithmic scale for the Y axis. Use Log Scale to see usage correlations for data with a wide range of values. For example, if a minority of your data is on a scale of tens, and a majority of your data is on a scale of thousands, the minority of your data is typically not visible in non-log scale graphs. Log Scale makes data on both scales visible by applying logarithmic values rather than actual values to the data. | |
| Base at Zero | Use zero as the y-axis minimum for all graph traces. | |
| Time Range |
Select a time range or All Data from the
drop-down menu. By default, the ending period for displayed data is the
current time. To specify a time range: 1. Click the 2. Change the time range end point by
clicking the 3. Click Apply. The navigation arrows
4. Use the navigation arrows |
|
| Activity Metrics for Selected Cache | Hits | The number of successful gets from this cache. |
| Total Gets | Requests for data from this cache. | |
| Cache Misses | The number of failed gets by this cache. | |
| Total Puts | The number of data stores into this cache. | |
| Evictions | The number of objects removed from the cache to make room for other objects. | |
| Write Queue | The size of the queue, in kilobytes, that holds data scheduled to be written to the cache store. | |
Cache Detail Tables
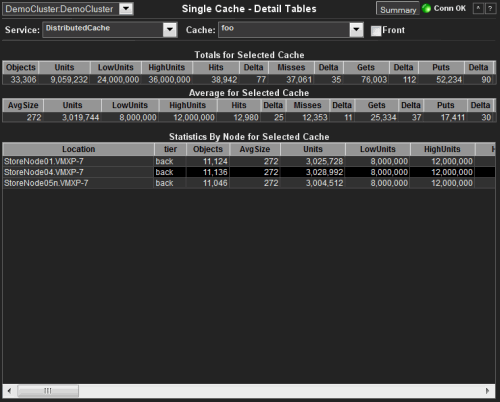
This display presents detailed information about
the contribution that each storage node makes to the cache. Select a node in the
Statistics By Node for Selected Cache
table to drill down to the Single Node Summary
for that node. The
data displayed here is broken down for each storage nodes in the cache filtered
by the selected service and cache.
| Cluster | Select a cluster from the drop-down menu. | |||
| Summary | Toggle between this display and Single Cache - Summary display. | |||
| Service | Select a Service to display. | |||
| Cache | Select a Cache to display. | |||
| Front | Select for front tier, deselect for back tier. | |||
| Totals for Selected Cache | Objects | Number of objects in this cache . | ||
| Units | Total number of units (typically bytes) in this cache. | |||
| LowUnits | Low limit for cache evictions. | |||
| HighUnits | Highest number of units before evictions occur. | |||
| Hits | Total number of successful gets. | |||
| Misses | Total number of failed gets. | |||
| Gets | Total requests for data from this cache. | |||
| Puts | Total data stores into this cache. | |||
| Average for Selected Cache | Objects | Number of objects in this cache. | ||
| AvgSize | Average size of objects in this cache. | |||
| Units | Average number of units (typically bytes) in this cache. | |||
| LowUnits | Low limit for cache evictions. | |||
| HighUnits | Highest number of units before evictions occur. | |||
| Hits | Average number of successful gets. | |||
| Misses | Average number of failed gets. | |||
| Gets | Average requests for data from this cache. | |||
| Puts | Average data stores into this cache. | |||
| Statistics By Node for Selected Cache | The columns in this table, with the exception of Location, come from Cache and Node MBeans. For details on attributes of these MBeans go to: http://download.oracle.com/otn_hosted_doc/coherence/350/com/tangosol/net/management/Registry.html. | Location | A unique identifier for each node. It is defined as: member_name.machine.rack.site. | |
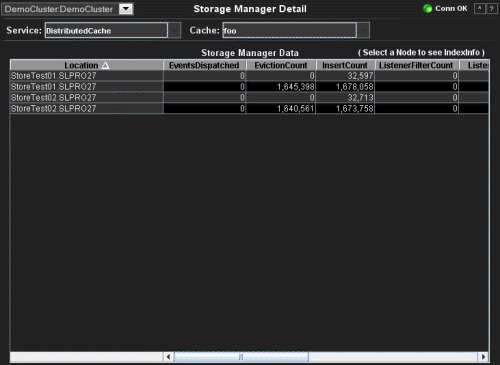
Storage Manager Detail
This display presents detailed
information about the Storage Manager.
The
data displayed here is queried from the Coherence StorageManagerMBean, filtered
by the selected service and cache. Click on a row in the table to open the
Storage
IndexInfo View display.
| Cluster | Select a cluster from the drop-down menu. | |
| Service | Select a service to display. | |
| Cache | Select a cache to display. | |
| Storage Manager Data | Location | A unique identifier for each node. It is defined as member_name.machine.rack.site. |
| EventsDispatched | The total number of events dispatched by the Storage Manager since the last time the statistics were reset. | |
| EvictionCount | The number of evictions from the backing map managed by this Storage Manager caused by entries expiry or insert operations that would make the underlying backing map to reach its configured size limit. | |
| InsertCount | The number of inserts into the backing map managed by this Storage Manager. In addition to standard inserts caused by put and invoke operations or synthetic inserts caused by get operations with read-through backing map topology, this counter is incremented when distribution transfers move resources `into` the underlying backing map and is decremented when distribution transfers move data `out`. | |
| ListenerFilterCount | The number of filter-based listeners currently registered with the Storage Manager. | |
| ListenerKeyCount | The number of key-based listeners currently registered with the Storage Manager. | |
| ListenerRegistrations | The total number of listener registration requests processed by the Storage Manager since the last time the statistics were reset. | |
| LocksGranted | The number of locks currently granted for the portion of the partitioned cache managed by the Storage Manager. | |
| LocksPending | The number of pending lock requests for the portion of the partitioned cache managed by the Storage Manager. | |
| RemoveCount | The number of removes from the backing map managed by this Storage Manager caused by operations such as clear, remove or invoke. | |
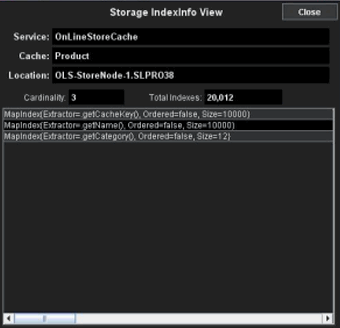
Click on a row in the Storage Manager Data table to open the Storage IndexInfo View display.
| Service | The name of the service. |
| Cache | The name of the cache. |
| Location | The location of the node associated with the cache. |
| Cardinality | The number of unique indexes associated with the cache. |
| Total Indexes | The number of indexes associated with this node and cache. |
| (Index Table) |
Each row in the
table represents a unique index, where: Extractor = the index name. Ordered = true/false to indicate whether or not the data is sorted (false means the data is not sorted). Size = the number of entries in that cache whose value matches that extractor. |
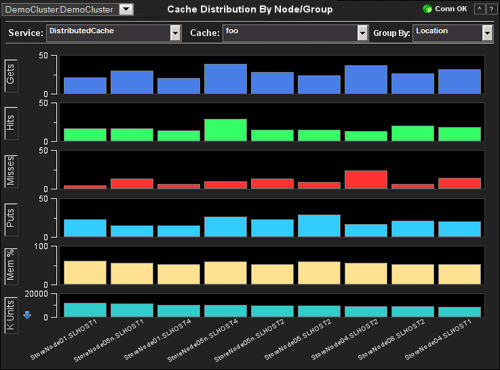
Node/Group Distribution
This display presents the
distribution of cache activity across all storage nodes in the cluster. The buttons
on the left may be used to select the metric by which all six bar charts are to
be sorted. Note that the Gets, Hits,
Misses, and Puts are shown in the same color as on the other Cache Analysis
displays.
The data
displayed here is broken down for each storage nodes in the cache filtered by
the selected service and cache.
| Cluster | Select a cluster from the drop-down menu. |
| Service | Select a service to display. |
| Cache | Select a cache to display. |
| Group By | Select the node group by which the data are totaled. Default is Location, a unique identifier for each node, defined as member_name.machine.rack.site. |
| Gets | Requests for data from this cache. |
| Hits | Number of successful gets. |
| Misses | Number of failed gets. |
| Puts | Data stores into this cache. |
| Mem % | Calculated percent of memory used divided by total memory. |
| K Units | Units in thousand bytes. |
| Cluster | Select a cluster from the drop-down menu. | ||
| Service | Select a service to display. | ||
| Cache | Select a cache to display for the selected Service. | ||
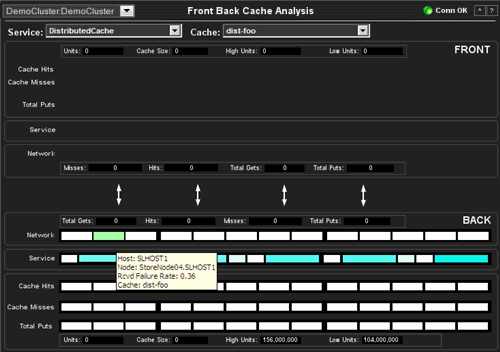
| FRONT/BACK | Units | Front | Number of objects. The value is the total across all storage nodes for the given tier. |
| Back | Memory usage. The value is the total across all storage nodes for the given tier. | ||
| Cache Size | Total number of objects in the cache for the given tier (Front or Back). NOTE: Same value as Units for Front tier. | ||
| High Units | Front | Number of objects allowed before Coherence starts to evict objects from the selected cache. The value is the total across all storage nodes for the given tier. | |
| Back | Maximum memory allowed before Coherence starts to evict objects from the selected cache. The value is the total across all storage nodes for the given tier. | ||
| Low Units | Front | Number of objects to which Coherence will reduce the cache during the eviction process. The value is the total across all storage nodes for the given tier. | |
| Back | The level of memory to which Coherence will reduce the cache during the eviction process. The value is the total across all storage nodes for the given tier. | ||
| Cache Hits | Number of successful gets | ||
| Cache Misses | Number of failed gets | ||
| Total Puts | Data stores into this cache | ||
| Service | CPU usage (%) for the node. | ||
| Network | Front | Sent Packet Failure Rate (%) for the node. | |
| Back | Received Packet Failure Rate (%) for the node. | ||
| Misses | Number of failed gets. | ||
| Hits | Number of successful gets. | ||
| Total Gets | Total requests for data from this cache. | ||
| Total Puts | Total data stores into this cache. | ||
|
RTView contains components licensed under the Apache
License Version 2.0. |
|
Treemap Algorithms v1.0 is used without
modifications and licensed by MPL Version 1.1. Copyright © 2001 University of
Maryland, College Park, MD |
|
Datejs is licensed under MIT. Copyright © Coolite Inc. |
|
jQuery is
licensed under MIT. Copyright © John Resig, |
|
JCalendar 1.3.2 is licensed under LGPL.
Copyright © Kai Toedter. |
|
jQuery is licensed under MIT. Copyright (c) 2009 John
Resig, http://jquery.com/ JCalendar 1.3.2 is licensed under LGPL.
Copyright © Kai Toedter. |
|
JMS, JMX and Java are trademarks or registered trademarks
of Sun Microsystems, Inc. in the United States and other countries. They are
mentioned in this document for identification purposes only. |
|
SL, SL-GMS, GMS, RTView, SL Corporation, and
the SL logo are trademarks or registered trademarks of Sherrill-Lubinski
Corporation in the United States and other countries. Copyright © 1998-2011
Sherrill-Lubinski Corporation. All Rights Reserved. |

