|
|
Oracle Coherence Monitor
User Guide |
|
|
Using the Monitor -
Single Node
Single Node
displays present detailed node performance
metrics for a single node. Use the
Single Node
displays to perform node utilization analysis.
-
Node Summary
Summary view showing details about a single node. -
Service Trends
Trend graphs showing metrics on a selected node of a selected service. Allows you to visually compare the behavior of metrics over time, for a given node. -
Node Detail
Tables showing metrics for Node, Cache, Invocation Service, Cache Service, and Storage Manager MBeans. -
JVM Summary
Runtime, class loader, thread, OS and input arguments. -
JVM Memory Trends
Heap and non-heap memory trends. -
JVM GC Trends
Memory usage before and after garbage collection and Garbage Collector activity. -
System Properties
Table of Java properties for a selected node.
NOTE: Click the
![]() button to view
the current display in a new window.
button to view
the current display in a new window.
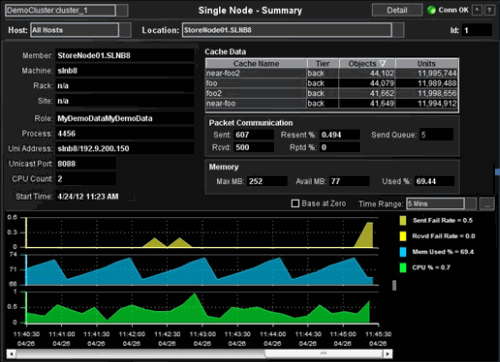
Node Summary
This display presents
summary information about an individual node.
| Cluster | Select a cluster from the drop-down menu. | |
| Detail | View Node Detail display. | |
| Host | Select a host from the drop-down menu. | |
| Location | Select a location from the drop-down menu. | |
| Id | The id for the selected node. | |
| Member | The member name for this node. | |
| Machine | The machine name for this node. | |
| Rack | The rack name for this node. | |
| Site | The site name for this node. | |
| Role | The role name for this node. | |
| Process | The process name for this node. | |
| Uni Address | The unicast address. This is the IP address of the node's DatagramSocket for point-to-point communication. | |
| Unicast Port | The unicast port. This is the port of the node's DatagramSocket for point-to-point communication. | |
| CPU Count | Number of CPU cores for the machine this node is running on. | |
| Start Time | The date and time that the selected node joined the cluster. | |
| Cache Data | Cache Name | Name of Cache. |
| Tier | Front or Back. | |
| Objects | Number of objects. | |
| Units | Number of units (typically bytes). | |
| Packet Communication | Sent | Cumulative number of packets sent by this node since the node statistics were last reset. |
| Rcvd | Cumulative number of packets received by this node since the node statistics were last reset. | |
| Resent % | Cumulative number of packets resent by this node since the node statistics were last reset. | |
| Rptd % | Cumulative number of packets repeated by this node since the node statistics were last reset. | |
| Send Queue | The number of packets currently scheduled for delivery, including packets sent and still awaiting acknowledgment. Packets that do not receive an acknowledgment within the ResendDelay interval are automatically resent. | |
| Memory | Max MB | Total memory allocated. |
| Avail MB | Total memory available. | |
| Used % | Percent of allocated memory being used. | |
| Base at Zero | Use zero as the Y axis minimum for all graph traces. | |
| Time Range |
Select a time range or All Data from the
drop-down menu. By default, the ending period for displayed data is the
current time. To specify a time range: 1. Click the 2. Change the time range end point by
clicking the 3. Click Apply. The navigation arrows
4. Use the navigation arrows |
|
| Sent Fail Rate | Percentage of communication packages on this node that failed and needed to be resent. | |
| Rcvd Fail Rate | Percentage of received communication packages that failed and needed to be repeated. | |
| Mem Used % | Percent of memory used by the node. | |
| CPU % | Percent of CPU used by the node. | |
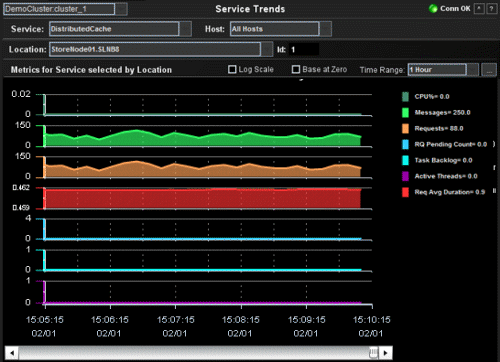
Service Trends
Trend graphs showing metrics on a selected node of a selected service. Allows you to visually compare the behavior of metrics over time, for a given node.
| Cluster | Select a cluster from the drop-down menu. | |
| Service | Select a service to display. | |
| Host | Select a host. | |
| Location | A unique identifier for each node. It is defined as: member_name.machine.rack.site. | |
| Log Scale | Enable to use a logarithmic scale for the Y axis. Use Log Scale to see usage correlations for data with a wide range of values. For example, if a minority of your data is on a scale of tens, and a majority of your data is on a scale of thousands, the minority of your data is typically not visible in non-log scale graphs. Log Scale makes data on both scales visible by applying logarithmic values rather than actual values to the data. | |
| Base at Zero | Use zero as the y-axis minimum for all graph traces. | |
| Time Range |
Select a time range or All Data from the
drop-down menu. By default, the ending period for displayed data is the
current time. To specify a time range: 1. Click the 2. Change the time range end point by
clicking the 3. Click Apply. The navigation arrows
4. Use the navigation arrows |
|
| Metrics for Service selected by Location | Trend chart displays the values of labeled Metrics for the selected Location (i.e. node) over the specified Time Range. | |
| CPU% | CPU Utilization (as a %) on the selected Location (i.e. node). | |
| Requests | Number of requests issued by the service in the measured period. | |
| Messages | The number of messages for the given node in the measured interval. | |
| Request Average Duration | Average duration (in milliseconds) of an individual request issued by the service since the last time the statistics were reset. | |
| Request Pending Count | Number of pending requests issued by the service. | |
| Task Backlog | Size of the backlog queue that holds tasks scheduled to be executed by one of the service threads. | |
| Active Threads | Number of threads in the service thread pool, not currently idle. | |
Node
Detail
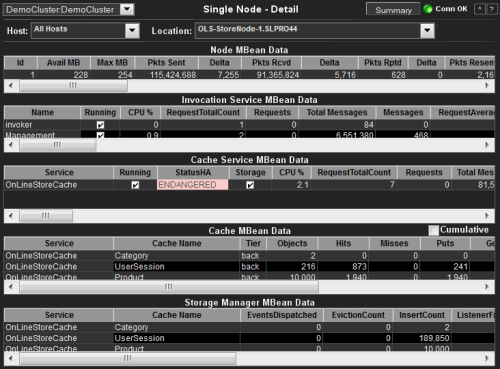
This display presents
detailed information about invocation services per node. The data on this display is queried from the Coherence MBeans.
NOTE: For details on attributes of
these MBeans go to:
http://download.oracle.com/otn_hosted_doc/coherence/350/com/tangosol/net/management/Registry.html.
| Cluster | Select a cluster from the drop-down menu. |
| Summary | View Node Summary display. |
| Host | Select a host. |
| Location | Select a location. |
| Node MBean Data | This table contains data from the Node MBean for the selected node. |
| Invocation Service MBean Data | This table contains data from the Invocation Services MBean for the selected node. |
| Cache Service MBean Data | This table contains data from the Cache Service and Node MBeans associated with the selected node. |
| Cache MBean Data | This table contains data from the Cache MBeans associated with the selected node. |
| Storage Manager MBean Data | This table contains data from the Storage Manager MBeans associated with the selected node. |
JVM
Summary
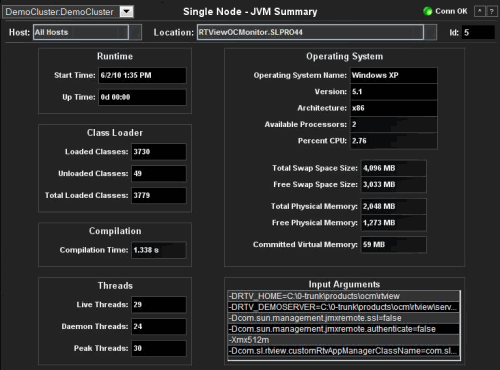
Runtime, class
loader, thread, OS and input arguments.
NOTE: Platform MBean information is available at:
http://java.sun.com/javase/6/docs/api/java/lang/management/package-summary.html#package_description.
| Cluster | Select a cluster from the drop-down menu. | |
| Host | Select a host. | |
| Location | Select a location. | |
| Id | Select a node id. | |
| Runtime | Start Time | The date and time that the JVM started. |
| Up Time | The uptime of the JVM. | |
| Class Loader | Loaded Classes | The number of classes that are currently loaded in the JVM. |
| Unloaded Classes | The total number of classes unloaded since the JVM started execution. | |
| Total Loaded Classes | The total number of classes that have been loaded since the JVM started execution. | |
| Compilation | Compilation Time | The
approximate accumulated elapsed time (in milliseconds) spent in compilation.
If multiple threads are used for compilation, then this value is a summation of the
approximate time that each thread spent in compilation.
NOTE: Compilation Time monitoring may not be supported depending on the platform (e.g.: a Java virtual machine implementation). |
| Threads | Live Threads | The number of live threads. |
| Daemon Threads | The number of live daemon threads. | |
| Peak Threads | The peak live thread count since the Java virtual machine started or peak was reset. | |
| Operating System | Operating System Name | The operating system name. |
| Version | The operating system version. | |
| Architecture | The operating system architecture. | |
| Available Processors | The number of processors available to the JVM. | |
| Percent CPU | Percent of CPU used by the JVM. | |
| Total Swap Space Size | The value of the OperatingSystemMXBean's TotalSwapSpaceSize attribute. | |
| Free Swap Space Size | The value of the OperatingSystem MXBean's FreeSwapSpaceSize attribute. | |
| Total Physical Memory | The value of the OperatingSystemMXBean's TotalPhysicalMemorySize attribute | |
| Free Physical Memory | The value of the OperatingSystemMXBean's FreePhysicalMemorySize attribute | |
| Committed Virtual Memory | The value of the OperatingSystemMXBean's CommittedVirtualMemorySize attribute | |
| Input Arguments | The list of JVM arguments in the RuntimeMXBean's InputArguments attribute | |
JVM
Memory Trends
Heap and non-heap
memory trends.
NOTE: Platform MBean information is available at:
http://java.sun.com/javase/6/docs/api/java/lang/management/package-summary.html#package_description.
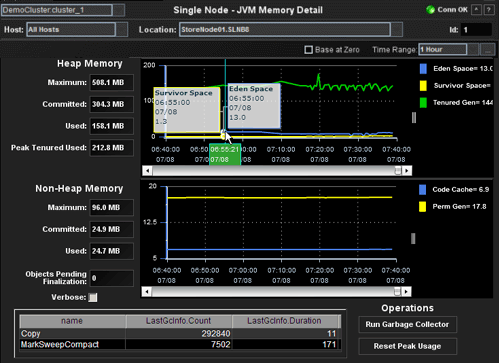
| Cluster | Select a cluster from the drop-down menu. | ||
| Host | Select a host. | ||
| Location | Select a location. | ||
| Id | Select a node id. | ||
| Base at Zero | Use zero as the Y axis minimum for all graph traces. | ||
| Time Range |
Select a time range or All Data from the
drop-down menu. By default, the ending period for displayed data is the
current time. To specify a time range: 1. Click the 2. Change the time range end point by
clicking the 3. Click Apply. The navigation arrows
4. Use the navigation arrows |
||
| Heap Memory | Maximum | The value of the max field within the MemoryMXBean HeapMemoryUsage attribute.. | |
| Committed | The value of the committed field within the MemoryMXBean HeapMemoryUsage attribute. | ||
| Used | The value of the used field within the MemoryMXBean HeapMemoryUsage attribute. | ||
| Peak Tenured Used | The value of the used field within the TenuredGen MemoryPoolMXBean PeakUsage attribute. | ||
| Non-Heap Memory | Maximum | The value of the max field within the MemoryMXBean NonHeapMemoryUsage attribute. | |
| Committed | The value of the committed field within the MemoryMXBean NonHeapMemoryUsage attribute. | ||
| Used | The value of the used field within the MemoryMXBean NonHeapMemoryUsage attribute. | ||
| Objects Pending Finalization | The value of the MemoryMXBean ObjectPendingFinalizationCount attribute. | ||
| Verbose | The value of the MemoryMXBean Verbose attribute. | ||
| Garbage Collection | name | Name of the Garbage Collector MBean. | |
| LastGcInfo.Count | The GcThreadCount from the Garbage Collector's LastGcInfo MBean. | ||
| LastGcInfo.Duration | The Duration from the Garbage Collector's LastGcInfo MBean. | ||
| Operations | Run Garbage Collector | Executes the MemoryMXBean gc operation. | |
| Reset Peak Usage | Executes the TenuredGen resetPeakUsage operation. | ||
JVM GC
Trends
Memory usage before
and after garbage collection and Garbage Collector activity.
NOTE: Platform MBean information is available at:
http://java.sun.com/javase/6/docs/api/java/lang/management/package-summary.html#package_description.
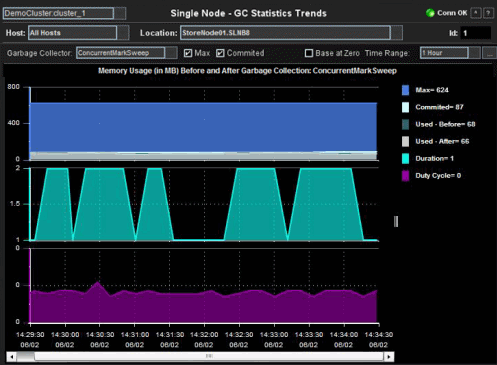
| Cluster | Select a cluster from the drop-down menu. | |
| Host | Select a host. | |
| Location | Select a location. | |
| Id | Select a node id. | |
| Garbage Collector | Select a Garbage Collector. | |
| Max | Select to add the Max trace (graph will rescale if necessary). | |
| Committed | Select to add the Committed trace (graph will rescale if necessary). | |
| Base at Zero | Use zero as the Y axis minimum for all graph traces. | |
| Time Range |
Select a time range or All Data from the
drop-down menu. By default, the ending period for displayed data is the
current time. To specify a time range: 1. Click the 2. Change the time range end point by
clicking the 3. Click Apply. The navigation arrows
4. Use the navigation arrows |
|
| Memory Usage (in MB) Before and After Garbage Collection | Max | The maximum amount of memory used by the node or nodes. |
| Committed | The amount of memory guaranteed to be available for use by the JVM. | |
| Used - Before | The amount of memory used by the node or nodes before garbage collection. | |
| Used - After | The amount of memory used by the node or nodes after garbage collection. | |
| Duration | The duration, in seconds, that memory is used by the node or nodes. | |
| Duty Cycle | Percent of time spent by the node or nodes in garbage collection. | |
System Properties
Table of Java
properties for a selected node.
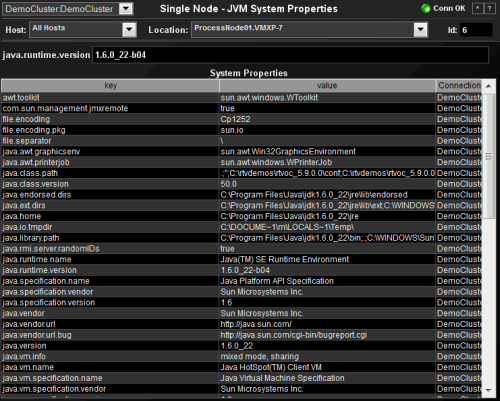
| Cluster | Select a cluster from the drop-down menu. |
| Host | Select a host. |
| Location | Select a location. |
| Id | Select a node id. |
| java.runtime.version | The value of the RuntimeMXBeans's VmVersion attribute. |
| System Properties | This table contains the attribute/value pairs from the RuntimeMXBean's SystemProperties attribute. |
|
RTView contains components licensed under the Apache
License Version 2.0. |
|
Treemap Algorithms v1.0 is used without
modifications and licensed by MPL Version 1.1. Copyright © 2001 University of
Maryland, College Park, MD |
|
Datejs is licensed under MIT. Copyright © Coolite Inc. |
|
jQuery is
licensed under MIT. Copyright © John Resig, |
|
JCalendar 1.3.2 is licensed under LGPL.
Copyright © Kai Toedter. |
|
jQuery is licensed under MIT. Copyright (c) 2009 John
Resig, http://jquery.com/ JCalendar 1.3.2 is licensed under LGPL.
Copyright © Kai Toedter. |
|
JMS, JMX and Java are trademarks or registered trademarks
of Sun Microsystems, Inc. in the United States and other countries. They are
mentioned in this document for identification purposes only. |
|
SL, SL-GMS, GMS, RTView, SL Corporation, and
the SL logo are trademarks or registered trademarks of Sherrill-Lubinski
Corporation in the United States and other countries. Copyright © 1998-2011
Sherrill-Lubinski Corporation. All Rights Reserved. |

