|
|
Oracle Coherence Monitor
User Guide |
|
|
Using the Monitor - Cache Services
Cache Services
displays present detailed
service performance metrics for the cluster.
Use the Cache Services displays to quickly identify
overloaded services and
locate the client connection causing the issue.
These displays show metrics for all cache services, including: CPU%, Requests, Request Average Duration, Request Pending Count, Task Backlog and Active Threads.
-
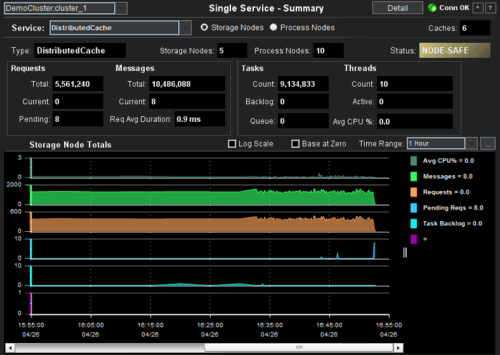
Single Service Summary
Trend graphs show performance metrics for a single service aggregated across all nodes. -
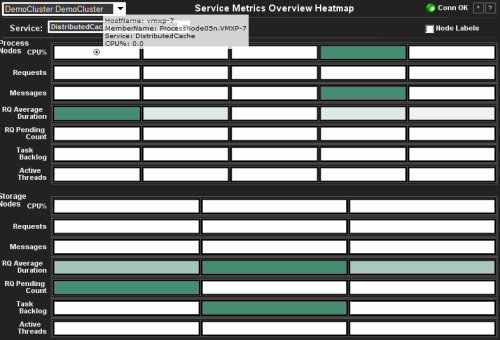
Service Metrics Overview
Heatmap shows overview of the current behavior of the cluster, displaying metrics across nodes in the cluster for a selected service or for all services. Enables you to determine if the behavior of the cluster is balanced across all nodes or identify if some nodes are hot spots. -
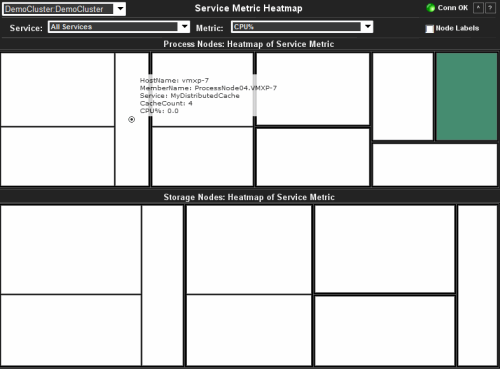
Service Metric Heatmap
Heatmap shows current value of a selected metric, selected by service, across the cluster. Enables you to determine if the behavior of the cluster, for the selected metric, is balanced or identify if some nodes are hot spots. -
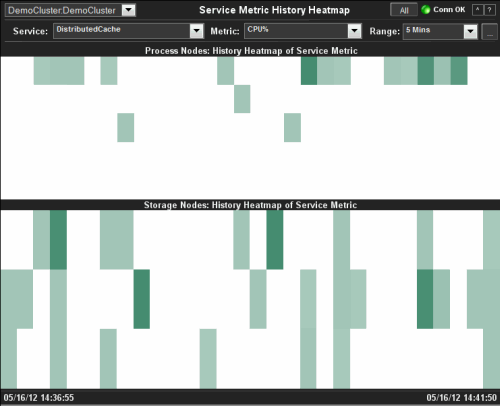
Single
Service History
Use this display to perform low-level analysis of service capacity utilization, over time, per node. Heatmap enables you to view the impact of events across the cluster as well as the relative historical performance of nodes across the cluster. -
Cache Service
Detail
Table view of attributes of a selected service for a selected host for nodes. Attribute values can be ordered to identify the nodes with the highest and lowest values of interest.
NOTE: Click the
![]() button to view
the current display in a new window.
button to view
the current display in a new window.
Single Service Summary
This display shows performance
metrics for a single service aggregated across all nodes.
| Cluster | Select a cluster from the drop-down menu. | |||
| Service | Select a service to display. | |||
| Storage Nodes | Select to display storage node data in the trend graphs of this display. | |||
| Process Nodes | Select to display process node data in the trend graphs of this display. | |||
| Caches | The number of caches managed by the service. | |||
| Type | The type of cache. | |||
| Storage Nodes | The number of storage nodes in the cache. | |||
| Process Nodes | The number of process nodes in the cache. | |||
| Status | The high availability status for the service. | |||
| MACHINE-SAFE | If a machine for the service goes offline the data stored on the machine remains available in the cluster (no data loss). | |||
| NODE-SAFE | If a node for the service goes offline (or is taken offline using kill-9) data stored on the node remains available in the cluster (no data loss). | |||
| ENDANGERED | If a node for the service goes offline the data stored on the node is potentially unavailable in the cluster (potential data loss). | |||
| Requests | Requests executed by the service. | |||
| Total | The number of requests executed. | |||
| Current | The number of requests currently being processed. | |||
| Pending | The number of pending requests. | |||
| Messages | Messages executed by the service. | |||
| Total | The number of messages executed. | |||
| Current | The number of messages currently being processed. | |||
| Req Avg Duration | The average amount of time to process messages. | |||
| Tasks | Tasks performed by the service. | |||
| Count | The number of tasks performed. | |||
| Backlog | The number of tasks scheduled to be executed by one of the service threads. | |||
| Queue | The Write Back Queue total across all caches on the service. | |||
| Threads | Threads on the service. | |||
| Count | The number of threads on the service. | |||
| Active | The number of threads in the service not currently idle. | |||
| Avg CPU % | The average amount of CPU usage (%) for the service. | |||
| Storage / Process Node Totals | The trend graphs show aggregated performance metrics for storage or process nodes. Choose Storage Nodes or Process Nodes at the top of this display. | |||
| Log Scale | Enable to use a logarithmic scale for the Y axis. Use Log Scale to see usage correlations for data with a wide range of values. For example, if a minority of your data is on a scale of tens, and a majority of your data is on a scale of thousands, the minority of your data is typically not visible in non-log scale graphs. Log Scale makes data on both scales visible by applying logarithmic values rather than actual values to the data. | |||
| Base at Zero | Use zero for the Y axis minimum for all graphs. | |||
| Time Range |
Select a time range or All Data from the
drop-down menu. By default, the ending period for displayed data is the
current time. To specify a time range: 1. Click the 2. Change the time range end point by
clicking the 3. Click Apply. The navigation arrows
4. Use the navigation arrows |
|||
Service Metrics Overview
Heatmap of Process (non-storage enabled) Nodes and Storage (enabled) Nodes. Size =
One Node. Color =
Relative Value of Selected Metric.
| Cluster | Select a cluster from the drop-down menu. | |||
| Service | Select a service to display. | |||
| Node Labels | Select to display node labels. | |||
| Process Nodes |
Color of the cells represents the relative value of the selected Metric; a darker shade is a larger value. The size of all cells is identical as they each represent one process node. |
Metric | CPU% | Percent of CPU utilization on the given node. |
| Requests | Number of requests issued by the service in the measured period. | |||
| Messages | The number of messages for the given node in the measured interval. | |||
| Request Average Duration | Average duration (in milliseconds) of an individual request issued by the service since the last time the statistics were reset. | |||
| Storage Nodes |
Color of the cells represents the relative value of the selected Metric; a darker shade is a larger value. The size of all cells is identical as they each represent one storage node. |
Request Pending Count | Number of pending requests issued by the service. | |
| Task Backlog | Size of the backlog queue that holds tasks scheduled to be executed by one of the service threads. | |||
| Active Threads | Number of threads in the service thread pool, not currently idle. | |||
Service Metric Heatmap
Heatmap of Process (non-storage enabled) Nodes and Storage (enabled) Nodes. Size = Number of Caches in
Selected Service, Color =
Relative Value of Selected Metric.
| Cluster | Select a cluster from the drop-down menu. | |
| Service | Select a service to display. | |
| Metric | CPU% | Percent of CPU utilization on the given node. |
| Requests | Number of requests issued by the service in the measured period. | |
| Request Average Duration | Average duration (in milliseconds) of an individual request issued by the service since the last time the statistics were reset. | |
| Request Pending Count | Number of pending requests issued by the service. | |
| Task Backlog | Size of the backlog queue that holds tasks scheduled to be executed by one of the service threads. | |
| Active Threads | Number of threads in the service thread pool, not currently idle. | |
| Node Labels | Select to view node locations. | |
| Process Nodes: Heatmap of Service Metric |
Color of the cells represents the relative value of the selected Metric for
a given process node; a darker shade is a larger value.
Size of the cells is based the number of caches in the selected Service for that process node. |
|
| Storage Nodes: Heatmap of Service Metric |
Color of the cells represents the relative
value of the selected Metric for a given storage node; a
darker shade is a larger value.
Size of the cells is based on the number of caches in the selected Service for that storage node. |
|
Single Service
History
Use this display to perform low-level analysis,
node-by-node, of service capacity utilization.
Heatmap of Process (non
storage enabled) Nodes and Storage (enabled) Nodes. Color = Relative Value of
Selected Metric.
| Cluster | Select a cluster from the drop-down menu. | |
| All | Click to view the All Services History display. | |
| Service | Select a service to display. | |
| Metric | CPU% | CPU Utilization (as a %) on the given node. |
| Requests | Number of requests issued by the service in the measured period. | |
| Request Average Duration | Average duration (in milliseconds) of an individual request issued by the service since the last time the statistics were reset. | |
| Request Pending Count | Number of pending requests issued by the service. | |
| Task Backlog | Size of the backlog queue that holds tasks scheduled to be executed by one of the service threads. | |
| Active Threads | Number of threads in the service thread pool, not currently idle. | |
| Range |
Select a time range or All Data from the
drop-down menu. By default, the ending period for displayed data is the
current time. To specify a time range: 1. Click the 2. Change the time range end point by
clicking the 3. Click Apply. The navigation arrows
4. Use the navigation arrows |
|
| Process Nodes: History Heatmap of Service Metric |
Color of the cells represents the relative value
of the selected Metric for a given process node;
a darker shade is a larger value.
The value of the Metric is displayed over the specified History for all process nodes in the selected Service. |
|
| Storage Nodes: History Heatmap of Service Metric |
Color of the cells represents the relative value
of the selected Metric for a given storage node;
a darker shade is a larger value.
The value of the Metric is displayed over the specified History for all storage nodes in the selected Service. |
|
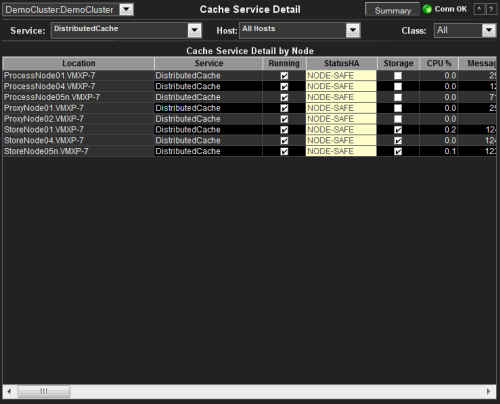
Cache Service Detail
This display provides a table view of attributes of a selected service for a selected host for nodes. Attribute values can be ordered to identify the nodes with the highest and lowest values of interest.
| Cluster | Select a cluster from the drop-down menu. | ||
| Summary | Click to view the Single Service - Summary display. | ||
| Service | Select a service to display. | ||
| Host | Select a host. | ||
| Class | Select the type of node to display: All, Storage or Process nodes. | ||
| Cache Service Detail by Node | The columns in this table, with the exception of Location, come from Service and Node MBeans. For details on attributes of these MBeans go to: http://download.oracle.com/otn_hosted_doc/coherence/350/com/tangosol/net/management/Registry.html. | Location | A unique identifier for each node. It is defined as member_name.machine.rack.site. |
|
RTView contains components licensed under the Apache
License Version 2.0. |
|
Treemap Algorithms v1.0 is used without
modifications and licensed by MPL Version 1.1. Copyright © 2001 University of
Maryland, College Park, MD |
|
Datejs is licensed under MIT. Copyright © Coolite Inc. |
|
jQuery is
licensed under MIT. Copyright © John Resig, |
|
JCalendar 1.3.2 is licensed under LGPL.
Copyright © Kai Toedter. |
|
jQuery is licensed under MIT. Copyright (c) 2009 John
Resig, http://jquery.com/ JCalendar 1.3.2 is licensed under LGPL.
Copyright © Kai Toedter. |
|
JMS, JMX and Java are trademarks or registered trademarks
of Sun Microsystems, Inc. in the United States and other countries. They are
mentioned in this document for identification purposes only. |
|
SL, SL-GMS, GMS, RTView, SL Corporation, and
the SL logo are trademarks or registered trademarks of Sherrill-Lubinski
Corporation in the United States and other countries. Copyright © 1998-2011
Sherrill-Lubinski Corporation. All Rights Reserved. |

