|
|
Oracle Coherence Monitor
User Guide |
|
|
Using the Monitor -
Alert Views
Use Alert
Views displays to track and manage
alerts for all Oracle Coherence nodes and caches in the cluster. Alerts are active
when they
are enabled
and an alert database is running. Enable and
disable alerts in the
Alert Administration
display.
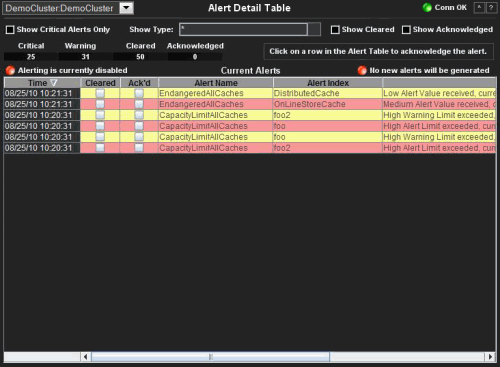
- Alert Detail Table
Table provides alert details in a time-ordered list of all alerts that have occurred. Manage active alerts, add comments and acknowledge alerts. -
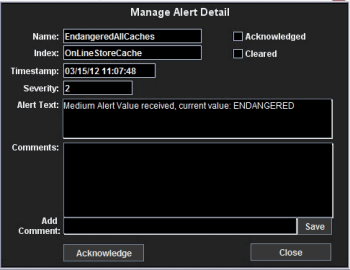
Manage Alert Detail dialog
The Manage Alert Detail dialog opens when you select an alert from the Alert Detail Table. Use this dialog to view or add comments about the alert, or to acknowledge an alert.
NOTE: Click the
![]() button to view
the current display in a new window.
button to view
the current display in a new window.
Alert Detail
Table
Track and manage
alerts
for all sources (nodes and caches) that have been issued since the OC Monitor
started.
View details such as where the alert originated and at what time. Click
the alert in the table to
open the Manage Alert Detail
dialog and acknowledge an alert or add comments.
Alerts are color-coded to visually indicate
the alert status:
| Red | Critical state: The critical threshold for this alert has been exceeded. |
| Yellow | Warning state: The warning threshold for this alert has been exceeded. |
Reduce the alert
types shown using the
Show Type
drop-down list. Reduce the alert states shown by selecting
Show Critical Alerts Only
or
Show Acknowledged.
Sort the data by column using the
![]() button.
button.

| Cluster | Select a cluster from the drop-down list. | |
| Connection Indicator | Color-coded icon visually indicates the data connection state between the OC Monitor and the data source. | |
| Green | The data source is connected. | |
| Red | The data source is disconnected (for example, if the Data Server is not receiving data from Oracle Coherence, or if the Display Server does not receive data from the Data Server, this indicator is red). | |
| Show Critical Alerts Only | Select to show only critical alerts in the table (and no warning alerts). Critical alerts have a severity level of 2. By default, critical and warning alerts are shown. | |
| Show Type | Select
an
alert type (also referred
to as the alert name)
to show in the table, or select * (asterisk) to show all alert types.
The table lists all sources (which are stated in the
Alert Index
column)
that have exceeded the
warning threshold for the selected alert type. A single alert type is applied to multiple sources (nodes or caches). Therefore if you select the AvailableMemoryLowNodeSpike alert type, multiple nodes might be shown if they have exceeded the warning threshold for that alert type. If you select the CapacityLimitCache alert type, multiple caches might be shown if they have exceeded the warning threshold for that alert type. If you select * (asterisk), all alert types are shown for all nodes and caches that have exceeded the warning threshold for any alert type. By default, all alert types are shown. |
|
| Show Cleared | Select to show cleared alerts. An alert is considered cleared when the source for the alert (node or cache) returns to below the alert threshold. By default, warning and critical alerts are shown. | |
| Show Acknowledged | Select to show acknowledged alerts. Acknowledged alerts have been manually acknowledged in the Manage Alert Detail dialog. Acknowledged alerts are automatically removed from the Current Alerts table. By default, warning and critical alerts are shown. | |
| Critical | Total number of critical alerts, including cleared alerts. Critical alerts have a severity level of 2. An alert is considered in a critical state if the source for the alert (node or cache) exceeds the critical threshold for the alert. | |
| Warning | Total number of warning alerts, including cleared alerts. Warning alerts have a severity level of 1. An alert is considered in a warning state if the source for the alert (node or cache) exceeds the warning threshold for the alert. | |
| Cleared | Total number of cleared alerts. An alert is considered cleared when the source for the alert (node or cache) returns to below the alert threshold. | |
| Acknowledged | Total number of acknowledged alerts. Acknowledged alerts have been manually acknowledged in the Manage Alert Detail dialog. Acknowledged alerts are automatically removed from the Current Alerts table. | |
|
|
Indicates that all alerting is suspended. Alerting is enabled and disabled in the Alert Administration display. | |
| Current Alerts |
The table lists all alerts for all sources
(nodes and caches) that have exceeded an alert threshold. Filter the alert
types shown using the
Show Type
drop-down list. Filter the alert states shown by selecting
Show Critical Alerts Only,
Show
Cleared or
Show Acknowledged.
Sort the data by column using the
Select an alert in the list to open the Manage Alert Detail dialog and acknowledge an alert or add comments. |
|
| Time | The time this alert was issued. | |
| Cleared | The checkbox is selected if this alert has cleared. An alert is considered cleared when the source for the alert (node or cache) returns to below the alert threshold. To include acknowledged alerts in the table, select Show Cleared. | |
| Acknowledged | The checkbox is selected if this alert has been acknowledged. Acknowledged alerts have been manually acknowledged in the Manage Alert Detail dialog. Acknowledged alerts are automatically removed from the Current Alerts table. To include acknowledged alerts in the table, select Show Acknowledged. | |
| Alert Name | The alert type. Alert types contain alert threshold definitions. A single alert type applies to all nodes or caches in the cluster. For example, the AvailableMemoryLowNodeSpike alert type applies to multiple nodes, and the CapacityLimitCache alert type applies to multiple caches. | |
| Alert Index |
The
Oracle Coherence source (the cluster name if the alert is a cluster alert,
otherwise the cluster name followed by the node or cache name) from which the alert originated.
As with nodes, a cluster can have multiple caches. A single alert type, such as CapacityLimitCache, applies to all caches in the cluster. The Alert Index identifies the cache from which the alert originated. |
|
| Alert Text | Descriptive information about the alert. | |
| ID | Unique ID for the alert. | |
Manage Alert Detail
The Manage Alert Detail dialog
opens when you select an alert from the Alert Detail
Table. Values shown in this dialog correspond to the alert selected from
the Alert Detail Table. Use the Manage Alert
Detail dialog to view or add comments about the alert, or to acknowledge an
alert.

| Name | The name of the alert. |
| Index | The Oracle Coherence source (the cluster name if the alert is a cluster alert, otherwise the cluster name followed by the node or cache name) from which the selected alert originated. Also the value from the Alert Index column for the source. |
| Timestamp | The time the alert was issued for the selected alert. |
| Severity | The severity of the alert. Critical alerts have a severity level of 2. Warning alerts have a severity level of 1. |
| Acknowledged | When checked, the alert has been manually acknowledged (by clicking Acknowledge in this dialog). |
| Cleared | When checked, the source for the alert (node or cache) has returned to below the alert threshold. |
| Alert Text | Descriptive text displayed for the alert. |
| Comments | Comments previously entered about the alert. |
| Add Comment | Enter alert-related comments in this field, then click Save. |
| Save | Click to add a comment in the Add Comment field. |
| Acknowledge | Click to acknowledge the alert. The Alert Detail Table Acknowledged column checkbox is checked when an alert is acknowledged. Acknowledged alerts are automatically removed from the Current Alerts table. |
| Close | Click to close the dialog. |
|
RTView contains components licensed under the Apache
License Version 2.0. |
|
Treemap Algorithms v1.0 is used without
modifications and licensed by MPL Version 1.1. Copyright © 2001 University of
Maryland, College Park, MD |
|
Datejs is licensed under MIT. Copyright © Coolite Inc. |
|
jQuery is
licensed under MIT. Copyright © John Resig, |
|
JCalendar 1.3.2 is licensed under LGPL.
Copyright © Kai Toedter. |
|
jQuery is licensed under MIT. Copyright (c) 2009 John
Resig, http://jquery.com/ JCalendar 1.3.2 is licensed under LGPL.
Copyright © Kai Toedter. |
|
JMS, JMX and Java are trademarks or registered trademarks
of Sun Microsystems, Inc. in the United States and other countries. They are
mentioned in this document for identification purposes only. |
|
SL, SL-GMS, GMS, RTView, SL Corporation, and
the SL logo are trademarks or registered trademarks of Sherrill-Lubinski
Corporation in the United States and other countries. Copyright © 1998-2011
Sherrill-Lubinski Corporation. All Rights Reserved. |
