RTView
Monitor
The RTView
Monitor enables you to monitor the
performance, and memory allocation and
utilization, for all licensed RTView Data
Servers, Display Servers, Historian applications and Tomcat applications in your
system. Use the RTView Monitor to determine how an RTView application is
utilizing its memory.
The RTView Monitor is a demo
application (located in the RTView demos/rtvmonitor directory) that you
can customize for your own system, including adding alerts. To start the RTView
Monitor demo, see Starting the RTView Monitor.
To customize the RTView Monitor, see Configuring
RTView Monitor.
The RTView
Monitor uses the RTView JMX Data Adapter to
display all connectivity information
available via JMX, as well as all detailed operational and management features
currently available via JMX.
Monitoring Tips:
- If your RTView system is unexpectedly slow,
use the RTView Monitor
to see how much memory is allocated and determine how it is being utilized. If
the amount of memory used is close to the amount designated, consider making
more memory available for the application.
-
When viewing metrics for application
usage of JVM heap and non-heap memory,
note that
heap usage might go up and down between garbage collection intervals
but, overall, the heap size should be stable. An exception to this is an RTView
server that runs the RTVIew cache data source. In that case, heap usage
grows until each cache history table reaches its maximum row counts or
timeSpan.
- Obtain performance metrics for
both before and after a failure.
- If an RTView application is not performing
as expected, investigate the following most critical and commonly
encountered issues:
| |
Display Server: Check CPU
usage. This is the most typical issue for the Display Server as the application
processes many user requests. |
| |
Data Server and Historian: Check both the
amount of available memory and memory used. The amount of memory used grows as
these applications run, so the amount of memory originally designated might no
longer be adequate. If the amount of memory used is close to the amount
designated, consider making more memory available. |
To configure the RTView Monitor, see
Configuring the RTView Monitor.
Configuring the RTView Monitor
This section provides step-by-step
instructions on how to setup your servers to be monitored by the RTView Monitor.
Basic Steps To Configure the RTView Monitor
Perform the following steps in the order
given to configure the RTView Monitor. Steps 2 and 3 are optional.
To setup
your servers for the RTView Monitor:
1. To set up your RTView servers for
monitoring, execute run_configutil.bat,
located in the /bin
directory. The Application Options dialog opens.
2. Select JMX from the list of options in the left pane.
3. Select the JMX Connections tab, then click Add Connection to open
the Add JMX Connection dialog.
4. In the Add JMX Connection dialog make the following entries:
Connection Name: Enter the connection name as you want it to appear in
the RTView Monitor.
Host or IP: Enter the server host
or IP address.
Port: Enter the JMX port number
assigned to that server.
NOTE: Use the additional fields only if
needed for your specific configuration.
The settings entered in the Add JMX Connection
dialog are stored in the
local JMXOPTIONS.ini file, located in the demos/rtvmonitor
directory (the
JMXOPTIONS.ini resides in the same
directory as the RTView Monitor application).
You can also use a text editor to edit the JMXOPTIONS.ini file, using the
following syntax:
| |
|
| |
jmxconn <servername> <IPaddress> <port> URL:- - - 'false' |
| |
Where: |
| |
<servername> is a name of
your choosing for the application. |
| |
<IPaddress> is the IP address
of the host on which the application runs. |
| |
<port> is the port number of the host on which the application runs. The
port number must be the same port number used when launching the respective server. |
| |
URL:- - - 'false' |
| |
|
| |
For example: |
| |
jmxconn
MyDataserver localhost 9952
URL:- - - ‘false’ |
| |
jmxconn
MyDisplayServer localhost 9953 URL: - - - ‘false’ |
| |
jmxconn
slhost1_OCM_HISTORIAN 192.168.200.101 9913
URL:- - - ‘false’ |
5. Click OK when you are finished.
6. To configure your servers to expose their
metrics through JMX, add the following parameter to the command line string
of each server:
| |
-jmxport:xxxxx
|
|
| |
Where xxxxx is the same
JMX
port number used to configure the RTView Monitor.
|
|
| |
NOTE: SL recommends port numbers above 10000 to avoid conflicts with
existing SL server application port numbers.
|
|
To (optionally) configure
Application Groups for the RTView
Monitor, continue to the next steps (below). To (optionally) modify the
RTView Monitor default settings, see
modify
the default settings
for the RTView Monitor.
Otherwise, proceed to
Start the RTView Monitor.
To configure Application Groups
for the RTView Monitor:
1.Edit the
appgroups.xml file,
located in the demos/rtvmonitor directory,
using the following format:
| |
<tr>
<td>ApplicationGroupName</td>
<td>NameOfAnApplication</td>
</tr> |
|
| |
|
|
| |
Where each row (<tr>) contains two
columns (<td>). The first column contains the name of the
Application Group, and the second column contains the name of an application to be
contained in that group.
|
|
Application groups allow you to organize your
application servers into categories for ease of access. You
can assign one or more servers to a group.
Application servers can belong to multiple groups.
In the following example, an Application Group
named DataServers contains two applications,
slhost1_OCM_DATASERVER and slhost3_OCM_DATASERVER:
| |
<?xml version="1.0"?>
<table key="app_groups">
<tc name="GROUPNAME"
type="string"
index="true"/>
<tc name="APPNAME"
type="string"
index="false"/>
<tr>
<td>DataServers</td>
<td>slhost1_OCM_DATASERVER</td>
</tr>
<tr>
<td>DataServers</td>
<td>slhost3_OCM_DATASERVER</td>
</tr>
</table>
</table>
</dataset> |
|
The XML code preceding the
first <tr> and following the last </tr> must not be altered.
To (optionally) modify the RTView Monitor
default settings, see
modify
the default settings
for the RTView Monitor(next). Otherwise, proceed to
Start the RTView Monitor.
To modify
the default settings
for the RTView Monitor:
Optionally, you can edit the default performance
settings for the RTView Monitor, such as the update period, in the
OPTIONS.ini file. The OPTIONS.ini file settings override settings
made in the Application Options dialog.
Proceed to
Starting the RTView Monitor.
Starting the RTView Monitor
This section provides step-by-step instructions
on how to start the
RTView Monitor in the Display Viewer
and the Thin Client.
Display Viewer
To
start the
RTView Monitor:
1.
In an
initialized command
prompt, navigate to
the core/demos/rtvmonitor directory and type:
run_viewer
The
RTView Monitor opens.
2. Verify that the
Connected check box in the table is checked for the applications you are
running. If an application that should be running is not checked, do the
following:
- Verify that the non-connected application is
running.
- Verify that it was started with the –jmxport:xxxx
parameter.
- Verify that the same application port number
is used for the –jmxport:xxxx parameter and the JMXOPTIONS.ini
file entry. If they do not match, edit the JMXOPTIONS.ini entry and
restart the RTView Monitor.
Thin Client
To
start the
RTView Monitor:
1. In a Web browser, navigate to:
http://localhost:xxxx/rtvmonitor/
where xxxx is the Web server port number.
The
RTView Monitor opens.
2.
Verify that the
Connected check box in the table is checked for the application/s you are
running. If an application that should be running is not checked, do the
following:
- Verify that the non-connected application is
running.
- Verify that it was started with the –jmxport:xxxx
parameter.
- Verify that the same application port number
is used for the –jmxport:xxxx parameter and the JMXOPTIONS.ini
file entry. If they do not match, edit the JMXOPTIONS.ini entry and
restart the RTView Monitor.
Proceed to
Verify your
setup.
Verifying Your Setup
Perform the following steps to verify
the RTView Monitor is setup properly.
To
verify your
RTView Monitor setup:
1. Verify that new application servers appear in the RTView Monitor:
Display Viewer
- Open the JMXOPTIONS.ini file in a
text editor (located in
the demos/rtvmonitor directory) and add
application servers using the following syntax: jmxconn
DisplayServer1 192.168.200.100 9997 URL:- - - 'false'
- Start the RTView Monitor.
- Verify that the application servers you
added appear in the Host and Application lists.
Thin Client
- Open the JMXOPTIONS.ini file in a
text editor (located in
the demos/rtvmonitor directory) and add
application servers using the following syntax: jmxconn
DisplayServer1 192.168.200.100 9997 URL:- - - 'false'
- Start
(or stop and the restart) the Display
Server.
- Verify that the application servers you
added appear in the Host and Application lists.
2. Verify that new Application Groups
appear in the RTView Monitor:
Display Viewer
- Create
a new Application Group in the appgroups.xml file.
- Save the appgroups.xml file
and start (or restart) the RTView Monitor.
- Verify that the Application Group
you added appears in the Host and Application lists.
Thin Client
- Create
a new Application Group in the appgroups.xml file.
- Save the appgroups.xml file.
- Verify that the Application Group
you added appears in the Host and Application lists.
NOTE: Any change to the Thin
Client JMXOPTIONS.ini file requires that the Display Server be
restarted (not the application). Changes to the appgroups.xml file does
not require anything to be restarted as it is read with each refresh, and
updated automatically.
3. Verify RTView Monitor GUI functionality:
- Click the Show Only Connected
checkbox so that only connected application servers are
displayed. Clear the checkbox and verify that both connected and
non-connected servers appear.
- Click entries in the
Applications list and verify that the detail pane is
populated with associated detail data.
4. Verify detail data displays
properly by clicking:
| |
a) Verify that fields are populated. |
|
|
b) Click the Time Rage drop-down and verify
that both graphs reflect the selected time range. |
|
| |
Verify that fields are populated and that the data is correct. |
|
|
| |
a) Verify that fields are populated and that the data is correct. |
|
|
b) Verify that Start Serving Data and
Stop Serving Data work as
expected. |
|
| |
c) Verify that Start Serving Data and
Stop Serving Data reflect their current state: enabled or disabled. |
|
| |
d) Verify that Serving Data reflects its
current state. |
|
| |
e) Verify that Current Number of Clients matches the number
of client rows displayed in the Client Data table. |
|
| |
a) Verify that fields are populated and that the data is correct. |
|
|
b) Verify that Clear Display Cache does clear
the cache. |
|
| |
a) Verify that fields are populated and that the data is correct. |
|
|
b) Verify that Start Storing Data
and Stop Storing Data work as
expected. |
|
| |
c) Verify that Start Storing Data
and Stop Storing Data reflect their current state: enabled or
disabled. |
|
| |
d) Verify that Storing Data reflects
its current status. |
|
| |
e) Verify that Purge Stored Data does purge the
stored data. |
|
| |
f) Verify that the Primary Server indicator reflects its
current status. |
|
| |
Verify that fields are populated and that the data is correct. |
|
|
| |
Verify that this panel only appears when App is selected and there is either no application server selected, or
the server is not currently connected. |
|
Your RTView Monitor setup is complete.
For details about Using the RTView Monitor, see
Using
RTView Monitor (next).
Using
RTView Monitor
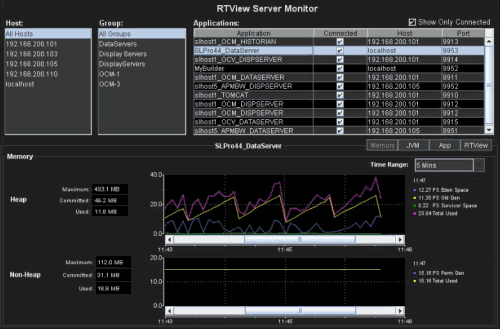
The RTView
Monitor main page lists all of the RTView Data Servers, Display Servers,
Historian applications and Tomcat applications in your system. The RTView
Monitor
provides information about the current status of RTView applications. Hosts
available are specified in the
JMXOPTIONS.ini file.
Select a
specific host or
All Hosts,
then select a specific group or
All Groups,
to populate the
RTView
Applications
table. Select an application from the RTView Application table to populate the
lower pane of the screen. Choose one of the
following to drill down to detailed information for the application:
-
Memory
- View metrics for JVM heap and non-heap memory
usage by the application. Note that
heap usage might go up and down between garbage collection intervals
but, overall, the heap size should be stable. An exception to this is an RTView
server that runs the RTVIew cache data source. In that case, heap usage
grows until each cache history table reaches its maximum row counts or
timeSpan.
-
JVM
- Monitor Java Virtual Machine memory
usage, get JVM system information,
application performance metrics, and input arguments for the application.
-
App
- Monitor application load and client
connections and manage the
Data Server, Display Server, Historian or Tomcat applications.
-
RTView
- View performance metrics for functions
and Web applications.
|
 |
|
Host |
Select a host. This list is
populated by the entries in the
JMXOPTIONS.ini file. For details, see
Configuring the RTView Monitor. |
| Group |
Select a group of applications
or All Groups.
Groups are available
if they are created in the
appgroups.xml file.
For details, see
setting up an Application Group. |
| |
|
Show Only Connected |
When checked, excludes non-connected servers
from the list in the RTView Applications
table. |
|
RTView Applications |
The table lists all RTView applications for the
selected group/s.
This list is populated by the entries in
the JMXOPTIONS.ini file. |
Application |
The host name on which the application resides
and the name of the application. |
| Group |
The name of the Group, if one was created, in which the application resides. |
| Connected |
Indicates that the
application is connected when checked. |
|
Host |
The IP address of the host on which the
application resides. |
|
Port |
The port number on the host that the application
uses. |
|
|
|
Memory |
Select to view details about JVM memory
usage for an application. Fields are populated by the selection made in the
RTView Applications table. |
|
Time Range |
Select the time range for the trend charts range
varying from 2 Minutes to Last 7 Days, or display All Data. |
|
Heap |
Displays data pertaining to JVM heap memory
allocation. That is, the allocation of
memory storage for use by an application at
runtime. These fields are populated by the selection made in the RTView
Applications table.
Further JVM details are available in the
JVM Details display.
NOTE: Heap usage
might go up and down between garbage collection intervals but, overall, the
heap size should be stable. An exception to this is an RTView
server that runs the RTVIew cache data source. In that case, heap usage
grows until each cache history table reaches its maximum row counts or
timeSpan. |
Maximum |
The maximum amount of memory used for memory
management by the application
in the time range
specified. This value may change or be undefined.
NOTE: A memory
allocation can fail if the JVM attempts to set the Used memory
allocation to a value
greater than the Committed memory allocation, even if the amount for
Used memory is less than or equal
to the Maximum memory allocation (for example, when the system is low on virtual memory). |
|
Committed |
The amount of memory guaranteed to be available
for use by the JVM. The amount of committed memory can be a fixed or
variable size. If set to be a variable size, the amount of committed memory
can change over time, as the JVM may release memory to the system. This
means that the amount allocated for Committed memory could be
less than the amount initially allocated. Committed memory
will always be greater than or equal to the amount allocated for
Used
memory. |
|
Used |
The amount of memory currently used by the
application. Memory used
includes the memory occupied by all objects including both reachable and
unreachable objects. |
|
Heap Trend Graph |
Displays data pertaining to JVM allocation of
memory storage for use by an application at
runtime. The graph is populated by the selection made in the RTView
Applications table. The memory pools available for display are
determined by the JVM being used.
Further JVM details are available in the
JVM Details display. |
Eden Space |
Traces the amount of memory used by the JVM eden
pool in the time range
specified. Eden refers to the
JVM eden pool, which is used to initially allocate memory for most objects. |
|
Old Gen |
Traces the amount of memory used by
objects that have survived
some number of young generation collections, as well as some large objects
that may be allocated directly in the old generation. |
|
PS Survivor Space |
Traces the amount of memory used by the JVM survivor
pool in the time range
specified. The JVM survivor pool
holds objects that survive the eden space garbage collection. |
|
Total Heap Memory Used |
Traces the total amount of heap memory used. |
|
Non-Heap
|
Displays data pertaining to JVM non-heap memory
allocation. That is, the allocation of
memory storage for the method area shared
by all threads, and the memory required for JVM internal processing.
The graph is populated by the selection made
in the RTView Applications table.
Further JVM details are available in the
JVM Details display. |
Maximum |
The maximum amount of memory used for JVM
non-heap memory management by the application
in the time range
specified. |
|
Committed |
The amount of memory guaranteed to be available
for use by JVM non-heap memory management. The amount of committed memory
can be a fixed or variable size. If set to be a variable size, it can change over time,
as the JVM may release memory to the system. This means that the amount
allocated for Committed memory could be
less than the amount initially allocated. Committed memory
will always be greater than or equal to the amount allocated for
Used
memory. |
|
Used |
The amount of memory currently used by the
application.
Memory used
includes the memory occupied by all objects including both reachable and
unreachable objects.
|
|
Non-Heap Trend Graph |
Displays data pertaining to JVM non-heap memory
allocation. The graph is populated by the selection made in the RTView
Applications table. The memory pools available for display are
determined by the JVM being used.
Further JVM details are available in the
JVM Details display. |
PS Perm Gen |
Traces the amount of memory used
by the pool containing reflective data of the virtual machine, such as class
and method objects. With Java virtual machines that use class data sharing,
this generation is divided into read-only and read-write areas. |
|
Total Used |
Traces the total amount of memory used. |
|
JVM |
Select to view JVM details. Fields are populated
by the selection made in the RTView Applications table. See
JVM Details, below. |
|
App |
Select to view application details. Fields are
populated by the selection made in the RTView Applications table. See
App Details, below. |
|
RTView |
Select to view RTView details. Fields are
populated by the selection made in the RTView Applications table. See
RTView Details, below. |
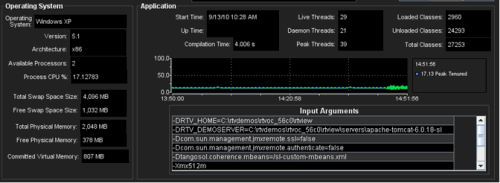
JVM Details
Use the
JVM Details
page to monitor Java Virtual Machine
memory usage, get JVM system information, application
performance metrics, and input arguments for the application. Verify whether the memory usage has reached a plateau. Or,
if usage is getting close to the limit, determine whether to allocate more
memory.
To view, select JVM. Fields
are populated by the selection made in the RTView Applications table.
JDK 5.0
Some data is only available for JDK v5.0+. JDK
v5.0+ extends the Operating System MBean to include the following operating
system resource information:
- CPU processing time
- total amount of memory
- total amount of free physical memory
- total amount of committed virtual memory (virtual memory guaranteed to be
available to the running process)
- total amount of swap space
- total amount of free swap space
|
 |
|
Operating System |
Displays data pertaining to The operating
system running on the host on which the JVM resides. Fields
are populated by the selection made in the RTView Applications table. |
Operating System |
The name of the
operating system running on the host on which the JVM resides. |
| Version |
The operating system version. |
| Architecture |
The ISA used by
the processor. |
| Available Processors |
The total number
of processors available to the JVM. |
| Process CPU % |
The average amount
of CPU usage by the JVM, in percent. |
| Total Swap Space Size |
The total amount
of swap space, in megabytes, allocated for the JVM (visible with JDK v5.0+). |
| Free Swap Space Size |
The total amount
of currently free swap space, in megabytes, available to the JVM (visible
with JDK v5.0+). |
| Total Physical Memory |
The total amount
of physical memory, in megabytes, allocated for the JVM (visible with JDK
v5.0+). |
| Free Physical Memory |
The total amount
of currently free physical memory, in megabytes, available to the JVM. |
| Committed Virtual Memory |
The total amount
of virtual memory guaranteed to be available to the running process, in megabytes, allocated for the JVM
(visible with JDK v5.0+). |
| |
|
Application |
Displays JVM data for the application selected in the RTView Applications
table. |
Start Time |
The date and time
that the application started running. |
|
Up Time |
The amount of time the application has been
running, in the following format: 0d
00:00
<days>d <hours>:<minutes>
For example:
30d 22:30 |
|
Compilation Time |
The approximate accumulated elapsed time (in
milliseconds) spent in compilation. If multiple threads are used for
compilation, then this value is a summation of the approximate time that
each thread spent in compilation. |
|
Live Threads |
The total number of live threads. |
|
Daemon Threads |
The total number of live daemon threads. |
|
Peak Threads |
The total number of peak live threads since the
Java virtual machine started or the peak was reset. |
|
Loaded Classes |
The total number of classes that are currently
loaded in the JVM. |
|
Unloaded Classes |
The total number of classes unloaded since the
JVM started executing. |
|
Total Classes |
The total number of loaded and unloaded classes
since the JVM started execution. |
|
Trend Graph |
Traces
the amount of memory used by
the
specific Java space (server or client) being published at the time. For example: Peak Tenured: Traces
the amount of memory used by
tenured JVM objects in the time range specified.
Tenured refers to JVM objects contained in a
pool that holds objects that have avoided garbage collection and reside in
the survivor space. Peak tenured refers to the maximum value of
the tenured memory over a specified period of time. |
|
Input Arguments |
The JVM arguments in the RuntimeMXBean
InputArguments attribute. |
App Details
Use the
App Details
page for Data Server, Display Server, Historian and Tomcat
applications to monitor processing load,
the number of client connections, and determine whether the number of client
connections or the load is getting close to the limit (and subsequently
whether these need to be reduced).
Fields are populated by the type of application selected in
the RTView Applications table.
To view, select App from the RTView
Monitor main page.
- Data Server
-
Monitor
Data Server application load, client connections and start or stop the
application.
- Display Server
- Displays information for Display
Servers, such as the number of active displays, functions, Web application load, and client connections.
You can also clear the display cache.
- Historian -
Displays the caches that are archived by the Historian application.
Also included are any substitution variables associated with the history
cache configuration file, as well as the history cache status.
- Tomcat -
Monitor
the performance of Tomcat application sessions and get Tomcat hosting and
connection details.
- RTView
-
Monitor performance between the
RTView application and the Data Servers, and monitor how long it takes for
an RTView application to execute functions.
Data Server
Monitor
Data Server application load, the amount of data sent by the Data Server and
and connected clients, and start or stop the
application.
To view Data Server application select App,
then select a Data Server application from the RTView Applications table.
|
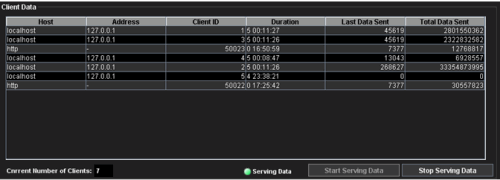 |
| Client
Data |
Displays metrics for data being sent to clients connected to the application
selected in the RTView Applications table. |
Host |
The host machine
for the client. |
| Address |
The client IP
address. |
| Client ID |
The client ID. |
| Duration |
The length of the
client-application session, with the following format: 00:00:00
hours:minutes:seconds
For example:
24:00:00 |
| Last Data Sent |
The amount of
data, in kilobytes, last sent to the client. |
| Total Data Sent |
The total amount
of data, in kilobytes, sent to the client since the session started. |
| |
|
Current Number of Clients |
The
total number of clients currently connected to the application. |
|
Serving Data |
When
green, indicates that the application is currently serving data to clients.
When red, indicates that the application is not currently serving data to
clients. |
|
Start Serving Data |
Click
to start or resume serving data. |
|
Stop Serving Data |
Click
to stop serving data. |
Display Server
View the number of active displays, functions, Web application load, and client connections
on the Display Server.
You can also clear the display cache.
To view Display Server application select App,
then select a Display Server application from the RTView Applications table.
|
 |
|
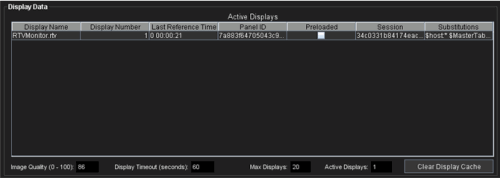
Display Data |
Fields
are populated by the selection made in the RTView Applications table. |
| Active
Displays |
Lists
the displays currently operational for the application selected in the
RTView Applications table. |
Display Name |
The display (.rtv)
file name. |
| Display Number |
The
display number is a value that ranges from 1 to N, where N
is the number of displays currently in the cache. This number is not tied to
a particular display, and can change as displays are automatically removed
from the cache. |
| Last Reference
Time |
The
amount of time that has elapsed since the display was last requested by a
client. |
| Panel ID |
A unique string identifier assigned to each panel. The Display Server loads
each display requested by each client into a panel. This ID can be useful in
troubleshooting. |
| Preloaded |
When checked,
indicates that the display (.rtv) file is configured in the
DISPLAYSERVER.ini
file to be preloaded. The
history_config option is used to configure display preloading.
Preloading a display makes data immediately available. Preloaded
displays are not unloaded unless the Display Server is restarted or the
display cache is cleared via JMX. This option can be used multiple times to
specify multiple displays to preload. |
| Session |
The
browser session ID for the client that requested the display. |
| Substitutions |
Lists the
substitutions used for the display which are specified in the
DISPLAYSERVER.ini file. |
| |
|
Image Quality (0 - 100) |
A
value between 0 and 100, set in the
DISPLAYSERVER.ini file, which controls
the quality of the generated images. If the value is 100, the Display Server
outputs the highest quality image with the lowest compression. If the value
is 0, the Display Server outputs the lowest quality image using the highest
compression. The default is 75. |
|
Display Timeout (seconds) |
The
amount of time, in seconds, that a display can be kept in memory after the
Display Servlet has stopped requesting it. This value is set in the
DISPLAYSERVER.ini file. Default is 60 seconds (to allow faster
load time when switching between displays). |
|
Max Displays |
The
number of displays kept in memory. This value is set in the
DISPLAYSERVER.ini file. Default is 20 (to optimize memory used by
the Display Server). |
|
Active Displays |
The
total number of displays currently being viewed by a user. |
|
Clear Display Cache |
Click
to unload and reload the
preloaded (shared) displays.
Use this when a shared display is modified while the Display Server is
running. |
Historian
View the caches that are
archived by the Historian application, substitution variables associated with the history
cache configuration file, as well as the history cache status. You can also
stop and start the Historian, and purge data.
To view Historian data select App, then
select a Historian application from the RTView Applications table.
|
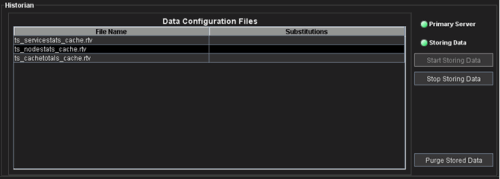 |
| Data
Configuration Files |
Lists the configuration files that are used by
the history cache. |
File Name |
The name of the history cache configuration
file. |
| Substitutions |
Lists
the substitutions specified in the history cache configuration file. |
| |
|
Primary Server |
When
green, indicates that this
Historian, when used within a group of Historians, is the primary group
member. If the primary member fails or shuts down, the standby member with
the highest priority becomes the primary group member.
When red, indicates that that this
Historian is a secondary server.
|
|
Storing Data |
When
green, indicates that this
Historian is actively archiving data. When
red, indicates that this
Historian is not actively archiving data. |
|
Start Storing Data |
Click
to start or resume archiving data on the history cache. |
|
Stop Storing Data |
Click
to stop archiving data on the history cache. |
|
Purge Stored Data |
Click
to remove all archived data on the history cache.
|
Tomcat
Monitor
the performance of Tomcat application sessions and get Tomcat hosting and
connection details. Use this data to verify response times of your Web applications.
To view Tomcat application data select App,
then select a Tomcat application from the RTView Applications table.
For more information about Tomcat, see The
Apache Software Foundation documentation, located at:
http://tomcat.apache.org/.
|
Tomcat |
The Tomcat pane displays hosting information for the Tomcat application, as
well as performance metrics. |
| Host Name |
The
name of the host where the application resides. |
| App Base |
The directory in which Tomcat
is installed. |
| Auto Deploy |
When
checked, indicates that Tomcat option, automatic application deployment, is enabled.
NOTE: This Tomcat option is set using the
autoDeploy
property in the server.xml file,
located in the Tomcat conf directory. autoDeploy=true enables
the option. |
| Unpack WARs |
When
checked, indicates that the option to unpack
WAR files located in the
application base directory
is enabled.
NOTE: This Tomcat option is set
using the
unpackWARs property
in the
server.xml file, located in the Tomcat conf directory.
When enabled (unpackWARs=true),
WAR files are unpacked into the appropriate folder off of the webapps
folder (the default base directory), and the applications run from that
directory. When disabled (unpackWARs=false),
the applications run directly from the WAR file.
More information about the Tomcat settings, refer to:
http://tomcat.apache.org/tomcat-5.5-doc/config/host.html#Introduction
and:
http://tomcat.apache.org/tomcat-5.5-doc/config/index.html
|
| Deploy On Startup |
When
checked, indicates that the option to deploy the application on Tomcat
startup is enabled.
NOTE: This Tomcat option is set
using the deployOnStartup property
in the
server.xml file, located in the Tomcat conf directory. When enabled (deployOnStartup=true),
applications from the host are automatically deployed.
|
| Connections |
Displays Tomcat application connection
information.
|
Port |
The
port number used by the Tomcat application on the host. |
| protocol |
The
protocol used by the Tomcat application on the host. |
| redirectPort |
The
redirect port number used by the Tomcat application on the host. |
| secure |
When
checked, specifies that the Tomcat application uses a secure connection on
the host. |
| |
|
Web Apps Summary
For more information about Tomcat, see The
Apache Software Foundation documentation, located at:
http://tomcat.apache.org/.
|
Displays servlet
information.
|
path |
The
path of the Web application. |
| activeSessions |
The number of clients currently in
session with the servlet. |
| expiredSessions |
The number of clients currently in
session with the servlet. |
| processingTime |
The amount of time, in milliseconds, for the
servlet to process client requests. |
| averageAliveTime |
The average amount of time, in milliseconds, of
client sessions. |
|
|
|
Base Dir |
The webapps
folder, where applications are run from. |
|
Auto Resize |
When checked,
automatically resizes the Web Apps Table columns. |
RTView Details
Monitor the performance of specific
RTView application functions and get connection information for Data
Servers. From the
View
drop-down menu, select:
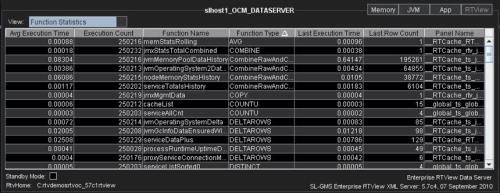
- Function Statistics: to verify
execution time for functions and expressions. Check for
slow Avg Execution Time values, and consider modifications to run
the application run more efficiently.
-
Dataserver
Connections: to
monitor the number of requests received by the Data Server, the last time a
request was received and the current status.
To view RTView Details data select App,
select an application from the RTView Applications table, then select
Function Statistics or
Dataserver
Connections from
the
View
drop-down menu.
|
 |
|
Function Statistics |
Displays statistics for RTView functions
executed by the application. |
Avg
Execution Time |
The
average amount of time, in milliseconds, for the function to execute.
|
|
Execution Count |
The
number of times that the function executed. |
|
Function Name |
The
name of the function . |
| Last
Execution Time |
The
amount of time, in milliseconds, the RTView function took to execute. |
| Last
Row Count |
The
number of rows in the most recent query result. |
| Panel
Name |
The
name of the panel within the RTView display in which the function executed. |
| |
|
Dataserver
Connections |
Displays connection information for the Data Server. |
Connected |
The
number of clients currently connected to the Data Server. |
|
ConnectionString |
The host and port number
of the connected Data Server. |
| Name |
The Data Server
name. |
|
ReceiveCount |
The
total number of requests received by the Data Server. |
|
ReceiveTime |
The time the last
message was received. |
| Status |
The command execution
status (OK, inactive,
no service or
no connection). |
|

