Fx
Graphs
The Fx Graphs tab features our Adobe®
Flash graphs that have been designed specifically for use in the Thin Client
deployment. These graphs are similar to other objects featured in the Graphs palette, but
support additional interactivity in the Thin Client deployment.
Due to the fact that these object use Adobe®
Flash, they have additional requirements and
limitations.
The Object Palette features two types of Fx
graph objects: Trend and Bar.Fx Trend Graph
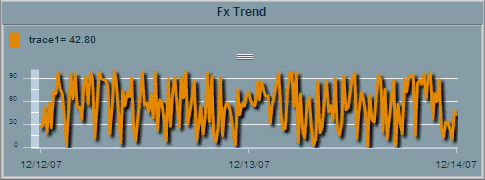
The Fx
trend graph (obj_fxtrend).
See the Fx Trend Graph section for more details on working with these graphs.
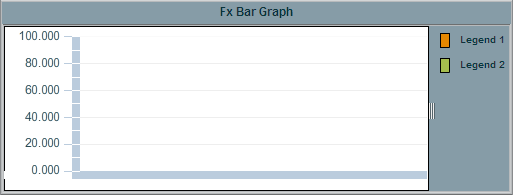
Fx Bar Graph
The Fx bar graph (class name: obj_fxbar).
See the Fx Bar Graph section for more details on working with these graphs.
Additional Interactivity
The Fx graphs support the
following runtime interaction:
- Zoom: zoom-in by dragging in trace area,
zoom-out by Shift+Click. NOTE: Zooming out is not enabled in the main window
of the Display Builder.
- Scrolling: live scrolling through time range
- Cursor: slide horizontally to see
interpolated data values in legend
- Data Tips: text boxes with data info popup
when the mouse is over a data point
- Legend: can be positioned above, below,
right, or left of trace area. The legend can be resized interactively, and
clicking on a trace's legend entry toggles the visibility of the trace.
Requirements and
Limitations
Requirements:
- The Fx graphs require version 9.0 or newer of
the Adobe®
Flash Player.
- In the Thin Client, the Fx graphs are
supported in any supported browser that has the Flash Player installed. If a
display containing an Fx graph is loaded into the Thin Client and the Flash
Player is not installed, a link to the Flash Player download page will
appear on the display.
Limitations:
- In the Display Builder and Display Viewer
applications, Fx graphs are supported on Windows platforms only. If a
display containing an Fx graph is opened in the Display Builder or Display
Viewer, and the correct version of the Flash Player is not available or the
local operating system is not Windows, the Fx graph will be blank and an
error message will be issued. In the Display Builder, the Fx Graphs tab will
still be visible.
- The Fx graphs are not supported in the Display
Viewer Applet on any platform.
- The Fx graphs can be resource intensive
during display loading and updating. This should be kept in mind when
designing displays. A display containing several Fx graphs may load
slowly.
- The Fx graphs are drawn inside a Flash Player
window. This means that Fx graphs will be drawn above all other objects
in a display, except other Fx objects, regardless of the object order. The
Move to Front and Move to Back operations have no effect on Fx graphs.
Also, in the Display Builder, if an Fx graph extends beyond the edges of the
display, it will obscure other panels in the Display Builder, such as the
object palette, property sheet, etc. When zooming or scrolling in the Display
Builder or Display Viewer, Fx graphs will obscure any portion of the vertical
and horizontal scrollbars that they overlap.
- In the Thin Client, if the context menu is
opened near an Fx graph, the menu will be partially hidden by the Fx object. Also, a right-click inside an Fx
graph will open the Flash Player
menu, not the Thin Client's context menu.
- When moving an Fx graph in the Display
Builder, it is best to grab and drag the object by one of its edges, just
inside the selection highlight rectangle. The graph can't be dragged from
within the plot area, since that will initiate a zoom. It can be dragged by
other interior areas, but it may not move smoothly.
|