|
|
Oracle Coherence Monitor
User Guide |
|
|
Using the Monitor -
All Nodes
All Nodes
displays present high-level node performance metrics for the cluster. Use the
All Nodes
displays to quickly assess total utilization metrics for all nodes in the
cluster.
-
All Nodes by Type/Host
Heatmap of caches by service where size represents Max Memory and color represents percent of Memory Used. -
All Nodes CPU
Heatmap shows CPU utilization for all nodes in the cluster. -
All Nodes -
Grid View
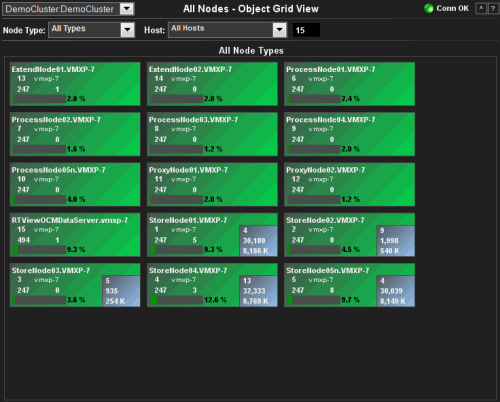
Grid view showing information about all nodes. -
Communication
Issues
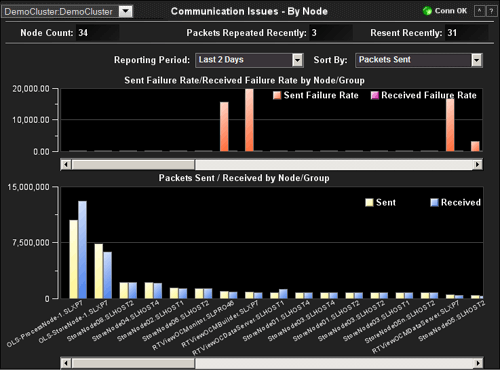
Bar chart displays current communication issues for all nodes. -
All
Nodes -
Detail
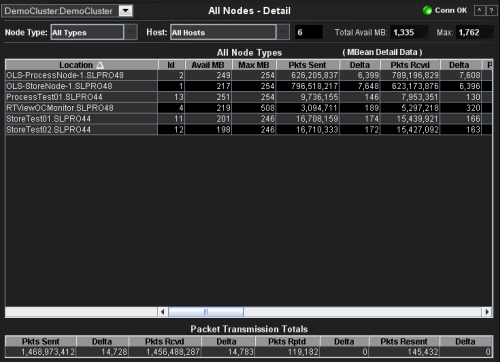
Table shows current detailed statistics for all nodes. -
Invocation Service Detail
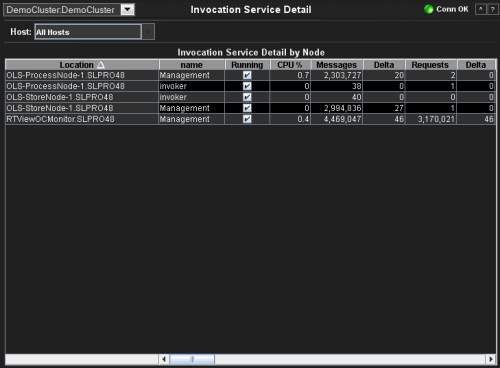
Table shows invocation service detail for all nodes.
NOTE: Click the
![]() button to view
the current display in a new window.
button to view
the current display in a new window.
All Nodes
by Type/Host/Memory
Heatmap of
nodes organized by Type and Host: Size = Max Memory, Color = Percent of Memory
Used.
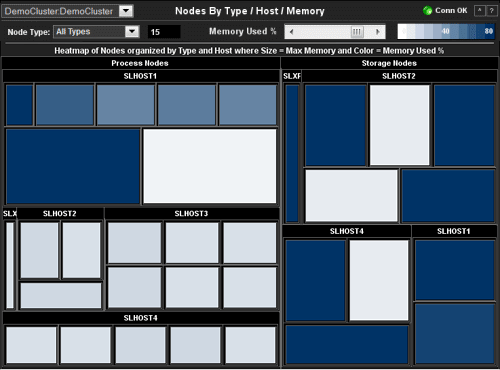
| Cluster | Select a cluster from the drop-down menu. |
| Nodes Type | Select the type of node to display: Storage Nodes, Process Nodes or All Types. |
| Memory Used % | Set the memory used percentage that maps to the maximum color value. Percentages greater than this value map to the maximum color value. |
| Heatmap of Nodes organized by Type/Host | A heatmap of memory usage per host. |
All Nodes
CPU
Heatmap
shows CPU utilization for
all nodes in the cluster
organized by Type and Host: Size = Max Memory, Color = Percent of CPU Used.
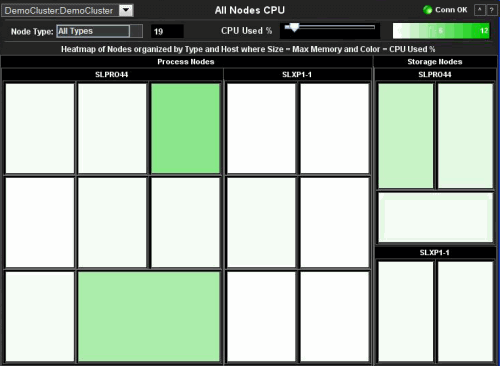
| Cluster | Select a cluster from the drop-down menu. |
| Node Type | Select the type of node to display. |
| CPU Used % | Set the CPU used percentage that maps to the maximum color value. Percentages greater than this value map to the maximum color value. |
| Heatmap of Nodes organized by Type/Host | A heatmap of CPU usage per host. |
All Nodes Grid View
This display shows
a grid view of all of the nodes in the selected
Node Type.
The following icon is shown for each node in the cluster:
|
|
The icon includes the node:
|
Communication Issues
This
display presents detail information about communication issues by node or group. Both bar charts show the
same data as the Packet Detail table. Click on a bar in either chart to drill
down to the Single Node Summary
display for that node.
| Cluster | Select a cluster from the drop-down menu. |
| Node Count | Number of nodes in the cluster. |
| Packets Repeated Recently | Total number of repeated packets since the last update. The update rate is set by the Reporting Period. |
| Resent Recently | Total number or resent packets since the last update. The update rate is set by the Reporting Period. |
| Reporting Period | Select period varying from 30 Seconds to Last 7 Days, or display All Data. |
| Sort By | Select Packets Sent, Packets Received, Sent Failure Rate or Received Failure Rate. |
| Sent Failure Rate/Received Failure Rate by Node/Group | Packets failed to be sent by each node. |
| Packets failed to be received by each node. | |
| Packets Sent/Received by Node/Group | Packets sent by each node. |
| Packets received by each node. | |
All Nodes - Detail
This display presents detailed
information about each node. This display includes information from the
Coherence ClusterNodeMBean for both storage and processing nodes. Select a node
in the All Node Data table to drill down to the Single
Node Summary
display for that node.
| Cluster | Select a cluster from the drop-down menu. | |
| Node Type | Select the type of nodes for which to display data: Storage Nodes, Process Nodes or All Types. | |
| Host | Select the host for which to display data, or select All Hosts. | |
| Node Count | Number of nodes for which data is currently displayed. | |
| Total Avail MB | Total available memory of all nodes in the cluster. | |
| Max | Total max memory of all nodes in the cluster. | |
|
All Node
Types (MBean Detail Data) |
Location | A unique identifier for each node. It is defined as: member_name.machine.rack.site. |
| Id | The short member id that uniquely identifies this member. | |
| Avail MB | The amount of available memory for this node in MB. | |
| Max MB | The maximum amount of memory for this node in MB. | |
| Pkts Sent | The cumulative number of packets sent by this node since the node statistics were last reset. | |
| Delta | The number of packets sent by this node since the last update. | |
| Pkts Rcvd | The cumulative number of packets received by this node since the node statistics were last reset. | |
| Delta | The number of packets received by this node since the last update. | |
| Pkts Rptd | The cumulative number of duplicate packets received by this node since the node statistics were last reset. | |
| Delta | The number of duplicate packets received by this node since the last update. | |
| Pkts Resent | The cumulative number of packets resent by this node since the node statistics were last reset. | |
| Delta | The number of packets resent by this node since the last update. | |
| Timestamp | The date and time (in cluster time) that this member joined the cluster. | |
| Pub Succ Rate | The publisher success rate for this node since the node statistics were last reset. Publisher success rate is a ratio of the number of packets successfully delivered in a first attempt to the total number of sent packets. A failure count is incremented when there is no ACK received within a timeout period. It could be caused by either very high network latency or a high packet drop rate. | |
| Rec Succ Rate | The receiver success rate for this node since the node statistics were last reset. Receiver success rate is a ratio of the number of packets successfully acknowledged in a first attempt to the total number of received packets. A failure count is incremented when a re-delivery of previously received packet is detected. It could be caused by either very high inbound network latency or lost ACK packets. | |
| Member | The member name for this node. | |
| Machine | The machine name for this node. | |
| Rack | The rack name for this node. | |
| Site | The site name for this node. | |
| Process | The process name for this node. | |
| Uni Addr | The unicast address. This is the IP address of the node's DatagramSocket for point-to-point communication. | |
| Uni Port | The unicast port. This is the port of the node's DatagramSocket for point-to-point communication. | |
| RoleName | The role name for this node. | |
| ProductEdition | The product edition this node is running. Possible values are: Standard Edition (SE), Enterprise Edition (EE), Grid Edition (GE). | |
| Send Queue | The number of packets currently scheduled for delivery, including packets sent and still awaiting acknowledgment. Packets that do not receive an acknowledgment within the ResendDelay interval are automatically resent. | |
| Packet Transmission Totals | Pkts Sent - Total cumulative packets sent by all nodes in the cluster since the node statistics were last reset.. | |
| Delta - Total packets sent by all nodes in the cluster since the last update. | ||
| Pkts Rcvd - Total cumulative packets received by all nodes in the cluster since the node statistics were last reset.. | ||
| Delta - Total packets received by all nodes in the cluster since the last update. | ||
| Pkts Rptd - Total cumulative packets repeated by all nodes in the cluster since the node statistics were last reset.. | ||
| Delta - Total packets repeated by all nodes in the cluster since the last update. | ||
| Pkts Resent - Total cumulative packets resent by all nodes in the cluster since the node statistics were last reset.. | ||
| Delta - Total packets resent by all nodes in the cluster since the last update. | ||
Invocation Service Detail
This display presents
detailed information about invocation services. The data displayed here is queried
from the Coherence ServiceMBean filtered to only display services of type
Invocation. Click on a node in
the table to drill down to the Single
Node Summary display for that node.
| Cluster | Select a cluster from the drop-down menu. | |
| Invocation Service Information | ||
| Location | A unique identifier for each node. It is defined as: member_name.machine.rack.site. | |
| name | The name of the invocation service. | |
| Running | Indicates that the invocation service is running when checked. | |
| CPU % | The percent (%) of CPU used by the node. | |
| Messages | The number of messages issued by the service to the node in a given time period. | |
| Delta | The number of messages received by the node since the last update. | |
| Requests | The number of requests issued by the service to the node in a given time period. | |
| Delta | The number of requests received by the node since the last update. | |
| RequestAverageDuration | The average duration (in milliseconds) of an individual synchronous request issued by the service since the last time the statistics were reset. | |
| RequestMaxDuration | The maximum duration (in milliseconds) of a synchronous request issued by the service since the last time the statistics were reset. | |
| RequestPendingCount | The number of pending synchronous requests issued by the service. | |
| RequestPendingDuration | The duration (in milliseconds) of the oldest pending synchronous request issued by the service. | |
| RequestTimeoutCount | The total number of timed-out requests since the last time the statistics were reset. | |
| RequestTimeoutMillis | The default timeout value in milliseconds for requests that can be timed-out (e.g. implement the com.tangosol.net.PriorityTask interface), but do not explicitly specify the request timeout value. | |
| TaskAverageDuration | The average duration (in milliseconds) of an individual task execution. | |
| TaskBacklog | The size of the backlog queue that holds tasks scheduled to be executed by one of the service pool threads. | |
| TaskCount | The total number of executed tasks since the last time the statistics were reset. | |
| TaskHungCount | The total number of currently executing hung tasks. | |
| TaskHungDuration | The longest currently executing hung task duration in milliseconds. | |
| TaskHungTaskId | The id of the of the longest currently executing hung task. | |
| TaskHungThresholdMillis | The amount of time in milliseconds that a task can execute before it is considered hung. Note that a posted task that has not yet started is never considered as hung. | |
| TaskMaxBacklog | The maximum size of the backlog queue since the last time the statistics were reset. | |
| TaskTimeoutCount | The total number of timed-out tasks since the last time the statistics were reset. | |
| TaskTimeoutMillis | The default timeout value in milliseconds for tasks that can be timed-out (e.g. implement the com.tangosol.net.PriorityTask interface), but do not explicitly specify the task execution timeout value. | |
| ThreadAbandonedCount | The number of abandoned threads from the service thread pool. A thread is abandoned and replaced with a new thread if it executes a task for a period of time longer than execution timeout and all attempts to interrupt it fail. | |
| ThreadAverageActiveCount | The average number of active (not idle) threads in the service thread pool since the last time the statistics were reset. | |
| ThreadCount | The number of threads in the service thread pool. | |
| ThreadIdleCount | The number of currently idle threads in the service thread pool. | |
| HostName | Name of the host machine on which the service resides. | |
| Throughput | The amount of data (in kilobytes) that is transferred by the service to the node. | |
| nodeId | The node id. | |
|
RTView contains components licensed under the Apache
License Version 2.0. |
|
Treemap Algorithms v1.0 is used without
modifications and licensed by MPL Version 1.1. Copyright © 2001 University of
Maryland, College Park, MD |
|
Datejs is licensed under MIT. Copyright © Coolite Inc. |
|
jQuery is
licensed under MIT. Copyright © John Resig, |
|
JCalendar 1.3.2 is licensed under LGPL.
Copyright © Kai Toedter. |
|
jQuery is licensed under MIT. Copyright (c) 2009 John
Resig, http://jquery.com/ JCalendar 1.3.2 is licensed under LGPL.
Copyright © Kai Toedter. |
|
JMS, JMX and Java are trademarks or registered trademarks
of Sun Microsystems, Inc. in the United States and other countries. They are
mentioned in this document for identification purposes only. |
|
SL, SL-GMS, GMS, RTView, SL Corporation, and
the SL logo are trademarks or registered trademarks of Sherrill-Lubinski
Corporation in the United States and other countries. Copyright © 1998-2011
Sherrill-Lubinski Corporation. All Rights Reserved. |

