|
|
Oracle Coherence Monitor
User Guide |
|
|
Using the OC Monitor
- All Caches
All Caches displays present high-level cache
performance metrics for the cluster. Use the
All Caches displays to quickly assess total
utilization metrics for all caches in the cluster.
-
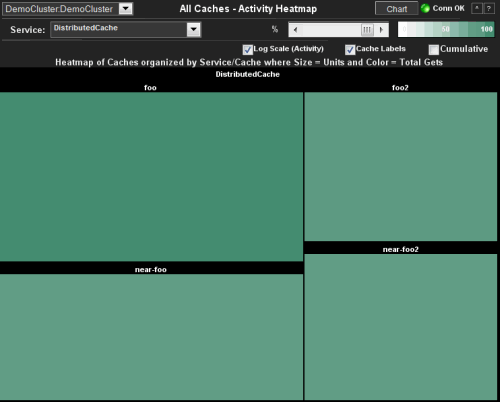
All Caches Heat Map
Heatmap of caches by service where size represents Units and color represents Total Gets %. -
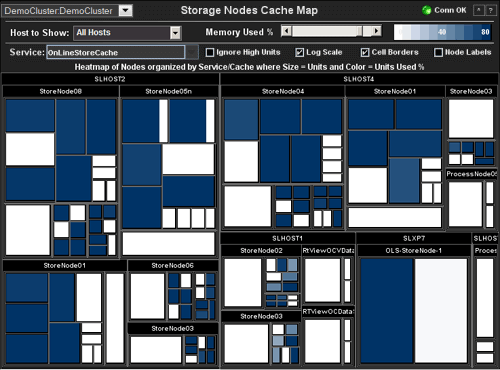
Storage Nodes Cache Map
Heatmap of memory usage on storage nodes by service where size represents Units and color represents Units Used %. -
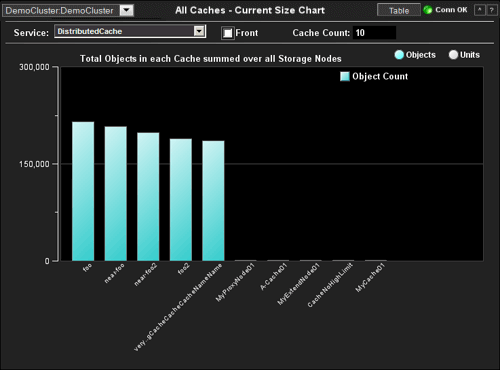
Current Size Chart
Bar chart/table sorted by caches with largest size displays current size/capacity metrics. -
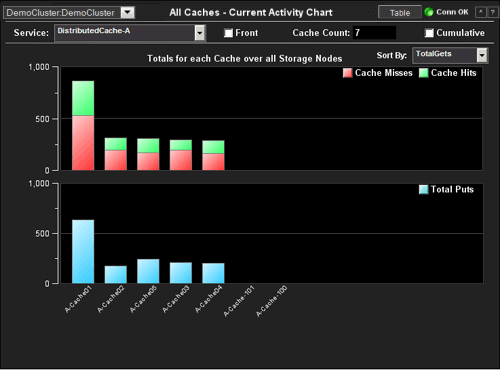
Current Activity Chart
Bar chart/table sorted by caches with greatest activity displays current activity metrics.
NOTE: Click the
![]() button to view
the current display in a new window.
button to view
the current display in a new window.
All Caches Heatmap
Heatmap of cache size and activity organized by service: Size = Number of Units, Color =
Percent of Total Gets.
| Cluster | Select a cluster from the drop-down menu. |
| Chart | Toggle between heatmap view and chart view. |
| Service | Select a service to display. |
| % | Set the activity percentage that maps to the maximum color value. Percentages greater than this value map to the maximum color value. |
| Log Scale (Activity) | Enable to use a logarithmic scale for the Y axis. Use Log Scale to see usage correlations for data with a wide range of values. For example, if a minority of your data is on a scale of tens, and a majority of your data is on a scale of thousands, the minority of your data is typically not visible in non-log scale graphs. Log Scale makes data on both scales visible by applying logarithmic values rather than actual values to the data. |
| Cache Labels | Select to display cache labels. |
| Cumulative | Select to show cumulative statistics for each cache. |
| Heatmap of Caches organized by Service/Cache | Activity heatmap where the activity metric is TotalGets. The levels of this heatmap are Service>Cache. The size of the cells is based on Units. The size of aggregate cells is based on the sum of the Units used by its component cells. The color of the cache cells is based on TotalGets. |
Storage Nodes Cache Map
Heatmap of memory usage on all storage nodes organized by service: Size = Number
of Units, Color = Percent of Units Used.
| Cluster | Select a cluster from the drop-down menu. |
| Host to Show | Select a host to display. |
| Memory Used % | Set the memory used percentage that maps to the maximum color value. Percentages greater than this value map to the maximum color value. |
| Service | Select
a service to display, or select All Services.
NOTE: When you select a specific service, only data for nodes running that service is displayed. This enables you to view services that only run on a subset of nodes. |
| Ignore High Units | Select to remove High Units from calculations. This results in all caches having 100% units used. The color of cache cells represents units used instead of percent Units used when this option is selected. |
| Log Scale | Enable to use a logarithmic scale for the Y axis. Use Log Scale to see usage correlations for data with a wide range of values. For example, if a minority of your data is on a scale of tens, and a majority of your data is on a scale of thousands, the minority of your data is typically not visible in non-log scale graphs. Log Scale makes data on both scales visible by applying logarithmic values rather than actual values to the data. |
| Cell Borders | Select to display heatmap cell borders. |
| Node Labels | Select to display node labels. |
| Heatmap of Nodes organized by Service/Cache | A heatmap of memory usage. The levels of this heatmap are Host>Node>Service>Cache. The size of the cells is based on Units. The size of aggregate cells is based on the sum of the Units used by its component cells. The color of cache cells is based on the percent of Units used unless Ignore High Units is selected. |
Current Size Chart
Toggle between bar chart and table views that present the latest values of total
objects and total units for each cache in the selected service.
| Cluster | Select a cluster from the drop-down menu. | ||||
| Table | Toggle between chart view and table view. | ||||
| Service | Select a service to display. | ||||
| Front | Select for front tier, deselect for back tier. | ||||
| Cache Count | Number of caches in the selected server. This is not available in the Table view. | ||||
| Current Size Chart | Total Objects in each Cache summed over all Storage Nodes |
This is the default view. Toggle between totals
for Object Count and Units Used.
Click the Table button to view Current Size Table. |
Objects | Object Count | Total number of objects in this cache. |
| Units | Units Used | Highest number of units before evictions occur. | |||
| Ignore High Units | Removes High Units bars from view. | ||||
| Current Size Table | Totals for each Cache over all Storage Nodes | Click Chart button to view Current Size Chart. | shortCacheName | Abbreviated name of cache | |
| tier | Front or back | ||||
| Objects | Total number of objects in this cache | ||||
| Units | Total number of units (typically bytes) in this cache | ||||
| LowUnits | Low limit for cache evictions | ||||
| HighUnits | Highest number of units before evictions occur | ||||
| Service | Name of selected service(s). | ||||
| Name | Full name of cache | ||||
Current Activity
Chart
Toggle between
bar chart and table views that present the latest values for activity metrics
for each cache in the selected service.
| Cluster | Select a cluster from the drop-down menu. | ||||
| Table | Toggle between chart view and table view. | ||||
| Service | Select a service to display. | ||||
| Front | Select for front tier, deselect for back tier. | ||||
| Cache Count | Number of caches in the selected server. This is not available in the Table view. | ||||
| Cumulative | Select to show cumulative statistics for each node since the start of the node. | ||||
| Current Activity Chart | Totals for each Cache over all Storage Nodes. |
This is the default view.
Click the Table button to view Current Activity Table.
|
Sort By | ||
| Cache Misses | Total number of failed gets | ||||
| Cache Hits | Total number of successful gets | ||||
| Total Puts | Total data stores into this cache | ||||
| Total Gets | Total requests for data from this cache | ||||
| Current Activity Table | Totals for each Cache over all Storage Nodes. | Click Chart button to view Current Activity Chart. | Cache | Abbreviated name of cache | |
| tier | Front or back | ||||
| Hits | Total number of successful gets | ||||
| Misses | Total number of failed gets | ||||
| Gets | Total requests for data from this cache | ||||
| Puts | Total data stores into this cache | ||||
| Hit % | Ratio of hits to gets | ||||
| Service | Service Name | ||||
| Cache Full Name | Full name of cache | ||||
|
RTView contains components licensed under the Apache
License Version 2.0. |
|
Treemap Algorithms v1.0 is used without
modifications and licensed by MPL Version 1.1. Copyright © 2001 University of
Maryland, College Park, MD |
|
Datejs is licensed under MIT. Copyright © Coolite Inc. |
|
jQuery is
licensed under MIT. Copyright © John Resig, |
|
JCalendar 1.3.2 is licensed under LGPL.
Copyright © Kai Toedter. |
|
jQuery is licensed under MIT. Copyright (c) 2009 John
Resig, http://jquery.com/ JCalendar 1.3.2 is licensed under LGPL.
Copyright © Kai Toedter. |
|
JMS, JMX and Java are trademarks or registered trademarks
of Sun Microsystems, Inc. in the United States and other countries. They are
mentioned in this document for identification purposes only. |
|
SL, SL-GMS, GMS, RTView, SL Corporation, and
the SL logo are trademarks or registered trademarks of Sherrill-Lubinski
Corporation in the United States and other countries. Copyright © 1998-2011
Sherrill-Lubinski Corporation. All Rights Reserved. |


