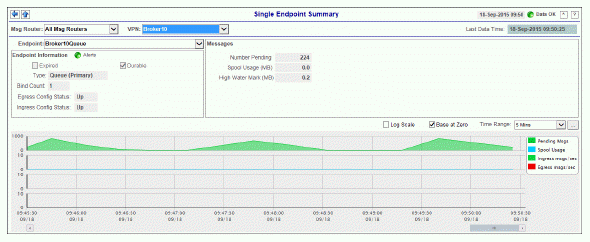
This display allows you to view endpoint information, message data, and a trend graph for pending messages, spool messages, incoming message rates, and outgoing message rates for a specific endpoint configured on a VPN. Choose a message router, VPN, and an endpoint from the drop-down menus, and use the Time Range to “zoom-in” or “zoom-out” on a specific time frame in the trend graph.
The Single Endpoint Summary display is provided by default and should be used if you do not want to collect message spool data for specific VPNs. However, if you do want to configure message spool monitoring for specific VPNs, then you should use this display instead, which is not included in the navigation tree by default.To collect message spool data for specific VPNs, disable the Single Endpoint Summary display, and enable the Single Endpoint Summary Rates display in the navigation tree, perform the following steps:
Uncomment and copy the following line in your sample.properties file to configure message spool monitoring for each VPN:
#collector.sl.rtview.cache.config=sol_cache_source_msg_spool.rtv $solConn:UNIQUE_APPLIANCE_NAME $solVpnName:VPN_NAME
To edit the navigation tree, extract solmon.navtree.xml from the rtvapm\solmon\lib\rtvapm_solmon.jar file and save it in the emsample\servers\central directory.
In the solmon.navtree.xml file, comment out the following line (enclose with <!-- and -->):
<node label="Single Endpoint Summary" display="sol_endpoint_summary"></node>
and add/uncomment this line:
<node label="Single Endpoint Summary Rates" display="sol_endpoint_summaryWithRates"></node>
Once the file is edited and saved in emsample\servers\central directory, it will get picked up automatically during startup.
Note: Collecting data for a large number of VPNs might impair the performance of the message router.

|
Title Bar: Indicators and functionality might include the following: |
||||
|
|
|
|||
|
Filter By: The display might include these filtering options: |
||||
|
|
Msg Router: |
Select the message router containing the VPN and client for which you want to view data. |
||
|
|
VPN |
Select the VPN associated with the selected message router and containing the client for which you want to view data. |
||
|
|
Endpoint |
Select the endpoint associated with the message router and VPN for which you want to view data. |
||
|
Fields and Data: |
||||
|
|
Last Data Time: |
Displays the last time the data was refreshed in the display. |
||
|
|
Endpoint Information |
Alerts |
The current status of the Alerts.
|
|
|
|
|
Expired |
When checked, performance data about the endpoint has not been received within the time specified (in seconds) in the $solRowExpirationTime field in the conf\rtvapm_solmon.properties file. The $solRowExpirationTimeForDelete field allows you to define the amount of time (in seconds) in which the row will be removed from the table if there is no response from the endpoint. To view/edit the current values, modify the following lines in the .properties file: # Metrics data are considered expired after this number of seconds # collector.sl.rtview.sub=$solRowExpirationTime:45 collector.sl.rtview.sub=$solRowExpirationTimeForDelete:3600 In the example above, the Expired check box would be checked after 45 seconds, and the row would be removed from the table after 3600 seconds. |
|
|
|
|
Durable |
Displays whether or not the endpoint is durable (checked) or non-durable (unchecked). Durable endpoints remain after an message router restart and are automatically restored as part of an message router’s backup and restoration process. |
|
|
|
|
Type |
The type of endpoint (either queue or topic). |
|
|
|
|
Bind Count |
The total number of binds connected to the endpoint. |
|
|
|
|
Egress Config Status |
The status of the egress configuration. |
|
|
|
|
Ingress Config Status |
The status of the ingress configuration. |
|
|
|
Messages |
Number Pending |
The total number of pending messages on the endpoint. |
|
|
|
|
Spool Usage (MB) |
The current spool usage consumed on the endpoint (in megabytes). |
|
|
|
|
High Water Mark (MB) |
The highest level of spool usage on the endpoint (in megabytes). |
|
|
Trend Graphs Traces the sum of process metrics for the endpoint associated with the selected message router and VPN.
|
||||
|
|
Log Scale |
Select to enable a logarithmic scale. Use Log Scale to see usage correlations for data with a wide range of values. For example, if a minority of your data is on a scale of tens, and a majority of your data is on a scale of thousands, the minority of your data is typically not visible in non-log scale graphs. Log Scale makes data on both scales visible by applying logarithmic values rather than actual values to the data. |
||
|
|
Base at Zero |
Select to use zero (0) as the Y axis minimum for all graph traces. |
||
|
|
Time Range |
Select a time range from the drop down menu varying from 2 Minutes to Last 7 Days, or display All Data. To specify a time range, click Calendar 
By default, the time range end point is the current time. To change the time range end point, click Calendar Use the navigation arrows Click Restore to Now to reset the time range end point to the current time.
|
||