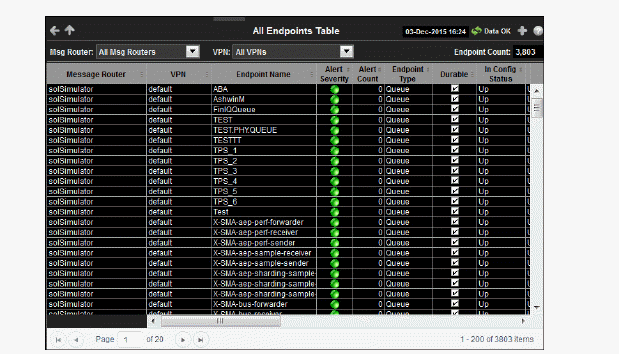
This display lists data in a table for all endpoints configured on a VPN. Each row in the table lists the details for a specific endpoint. You can click a column header to sort column data in numerical or alphabetical order, or drill-down and view details for a specific endpoint in the Single Endpoint Summary display by clicking on a row in the table.
|
Title Bar: Indicators and functionality might include the following: |
||||
|
|
|
|||
|
Filter By: The display might include these filtering options: |
||||
|
|
Msg Router: |
Select the message router for which you want to view data. |
||
|
|
VPN |
Select the VPN associated with the selected message router for which you want to view data. |
||
|
Fields and Data: |
||||
|
|
Endpoint Count: |
The total number of endpoints configured on the VPN and displayed in the table. |
||
|
|
Message Router |
Displays the name of the message router |
||
|
|
VPN |
The name of the VPN. |
||
|
|
Endpoint Name |
The name of the endpoint. |
||
|
|
Alert Severity |
The current alert severity in the row.
|
||
|
|
Alert Count |
The total number of active alerts for the endpoint. |
||
|
|
Endpoint Type |
The type of endpoint (either queue or topic). |
||
|
|
Durable |
Displays whether or not the endpoint is durable (checked) or non-durable (unchecked). Durable endpoints remain after an message router restart and are automatically restored as part of an message router’s backup and restoration process. |
||
|
|
In Config Status |
Refer to Solace documentation for more information. |
||
|
|
Out Config Status |
Refer to Solace documentation for more information. |
||
|
|
Type |
Refer to Solace documentation for more information. |
||
|
|
Access Type |
Refer to Solace documentation for more information. |
||
|
|
Bind Count |
The total number of binds connected to the endpoint. |
||
|
|
Pending Messages |
The total number of pending messages on the endpoint. |
||
|
|
Spool Usage (MB) |
The total spool usage consumed on the endpoint (in megabytes). |
||
|
|
High Water Mark (MB) |
The highest level of spool usage on the endpoint (in megabytes). |
||
|
|
In Selector |
Refer to Solace documentation for more information. |
||
|
|
Out Selector |
Refer to Solace documentation for more information. |
||
|
|
Expired |
When checked, performance data about the endpoint has not been received within the time specified (in seconds) in the $solRowExpirationTime field in the conf\rtvapm_solmon.properties file. The $solRowExpirationTimeForDelete field allows you to define the amount of time (in seconds) in which the row will be removed from the table if there is no response from the endpoint. To view/edit the current values, modify the following lines in the .properties file: # Metrics data are considered expired after this number of seconds # collector.sl.rtview.sub=$solRowExpirationTime:45 collector.sl.rtview.sub=$solRowExpirationTimeForDelete:3600 In the example above, the Expired check box would be checked after 45 seconds, and the row would be removed from the table after 3600 seconds. |
||
|
|
Time Stamp |
The date and time the data was last updated. |
||


 Open the online help page for this display.

