The following reports are available:
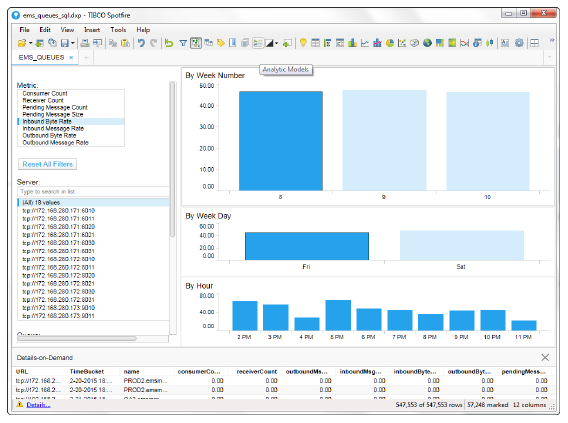
The EMS Queue Message Metrics Report allows you to details for various metrics for one or more selected servers.
|
Metrics and Data This report includes: |
|||
|
|
Metric |
Lists the metrics available for the report. |
|
|
|
|
Consumer Count |
The total number of consumers. |
|
|
|
Receiver Count |
The number of active receivers on the queue |
|
|
|
Pending Message Count |
Number of currently pending messages on the server. |
|
|
|
Pending Message Size |
Amount of space, in bytes, that the pending messages use on the server. |
|
|
|
Inbound Byte Rate |
The rate of inbound bytes per second. |
|
|
|
Inbound Msg Rate |
The rate of inbound messages per second. |
|
|
|
Outbound Byte Rate |
The rate of outbound bytes per second. |
|
|
|
Outbound Msg Rate |
The rate of outbound messages per second. |
|
|
Reset All Filters |
Resets any defined filters from the report. |
|
|
|
Server |
Select the server or servers for which you want to view data in the report. You can use the Search field to find a particular server. Selecting a server or servers from this list automatically updates the list of available queues in the Queues select list. |
|
|
|
Queue |
Select the queue or queues for which you want to view data in the report.You can use the Search field to find a particular queue. |
|
|
|
By Week Number |
Displays the averages (for the Rate metrics) or sums (for the Count metrics) for the selected server(s) for each week. You can hover over each week to view the exact counts or rates for that week. Clicking on a particular week displays data for each day for that particular week in the By Week Day region. |
|
|
|
By Week Day |
Displays the averages (for the Rate metrics) or sums (for the Count metrics) for each day in the selected week. Hovering over a particular day displays the exact sum or average for that day. Clicking on a particular day populates data for each hour in the By Hour region. |
|
|
|
By Hour |
Displays the averages (for the Rate metrics) or sums (for the Count metrics) for each hour in the selected day. Hovering over a particular hour displays the exact sum or average for that hour. Clicking on a particular hour updates the TimeBucket information in the Details-on-Demand region. |
|
|
|
Details-on-Demand |
Shows all metrics (Consumer Count, Receiver Count, Pending Message Count, Pending Size Count, Inbound Byte Rate, Inbound Msg Rate, Outbound Byte Rate, and Outbound Msg Rate) for each selected server at a specific time (TimeBucket (24 hour clock) and timestamp) based on the object selected in the dashboard (By Week Number, By Week Day, and By Hour). |
|
This report displays the sum or average of the selected metric for a server or servers by week number, by week day, and by hour of a particular day. You can hover over the various objects in the report to view more detailed information, or look in the Details-on-Demand region to view data details for a specific time bucket.
|
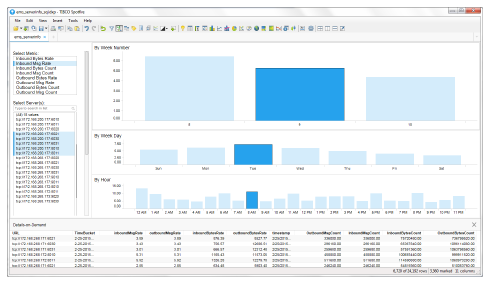
Metrics and Data This report includes: |
|||
|
|
Select Metric |
Lists the metrics available for the report. |
|
|
|
|
Inbound Bytes Rate |
The rate of inbound bytes per second. |
|
|
|
Inbound Msg Rate |
The rate of inbound messages per second. |
|
|
|
Inbound Bytes Count |
The number of inbound bytes received by the server since the server was started. |
|
|
|
Inbound Msg Count |
The number of inbound messages received by the server since the server was started. |
|
|
|
Outbound Bytes Rate |
The rate of outbound bytes per second. |
|
|
|
Outbound Msg Rate |
The rate of outbound messages per second. |
|
|
|
Outbound Bytes Count |
The number of outbound bytes sent by the server since the server was started. |
|
|
|
Outbound Msg Count |
The number of outbound messages sent by the server since the server was started. |
|
|
Select Server |
Select the server or servers for which you want to view data in the report. |
|
|
|
By Week Number |
Displays the averages (for the Rate metrics) or sums (for the Count metrics) for the selected server(s) for each week. You can hover over each week to view the exact counts or rates for that week. Clicking on a particular week displays data for each day for that particular week in the By Week Day region. |
|
|
|
By Week Day |
Displays the averages (for the Rate metrics) or sums (for the Count metrics) for each day in the selected week. Hovering over a particular day displays the exact sum or average for that day. Clicking on a particular day populates data for each hour in the By Hour region. |
|
|
|
By Hour |
Displays the averages (for the Rate metrics) or sums (for the Count metrics) for each hour in the selected day. Hovering over a particular hour displays the exact sum or average for that hour. Clicking on a particular hour updates the TimeBucket information in the Details-on-Demand region. |
|
|
|
Details-on-Demand |
Shows all metrics (Inbound Bytes Rate, Inbound Msg Rate, Inbound Bytes Count, Inbound Msg Count, Outbound Bytes Rate, Outbound Msg Rate, Outbound Bytes Count, Outbound Msg Count) for each selected server at a specific time (TimeBucket (24 hour clock) and timestamp) based on the object selected in the dashboard (By Week Number, By Week Day, and By Hour). |
|