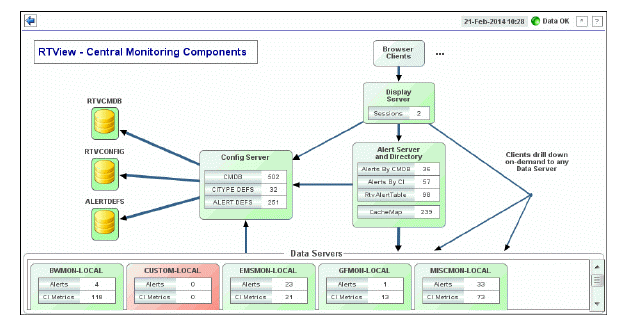
View the topology of the central RTView EM monitoring components and their current connection state. Each object represents a component which are color-coded to indicate component status. Red indicates the component stopped running. Green indicates the component is running.

|
Title Bar: Indicators and functionality might include the following: |
||||
|
|
|
|||
|
Fields and Data This display includes: |
|||
|
|
Config Server The Configuration Server provides configurations to all central RTView EM components. |
||
|
|
|
CMDB |
The number of CIs in the CMDB. |
|
|
CITYPE DEFS |
The current number of CITYPE definitions. |
|
|
|
ALERTDEFS |
The current number of alert settings and override definitions. |
|
|
|
Alert Server and Directory The Alert and Directory Server centralizes access to all alerts sent by remote Data Servers, and maintains a directory table of CI locations. The CI location is the name of the source Data Server. |
||
|
|
|
Alerts By CMDB |
The number of Services in the CMDB that currently have at least one associated alert. |
|
|
Alerts By CI |
The number of CIs in the CMDB that currently have at least one associated alert. |
|
|
|
RtvAlertTable |
The number of currently active alerts in the system. |
|
|
|
CacheMap |
The number of entries currently in the directory table. |
|
|
|
Display Server The Display Server generates HTML displays for browser clients. |
||
|
|
|
Sessions |
The current number of users connected to the Display Server. |
|
|
Browser Clients |
The browser clients are represented in the topology as a single object. No data is shown for browser clients. |
|
|
|
Data Servers This panel in the topology shows all Data Servers. |
||
|
|
|
Alerts |
The number of currently activated alerts for the Data Server. |
|
|
CI Metrics |
The count of CI metrics that the remote Data Server is sending. |
|