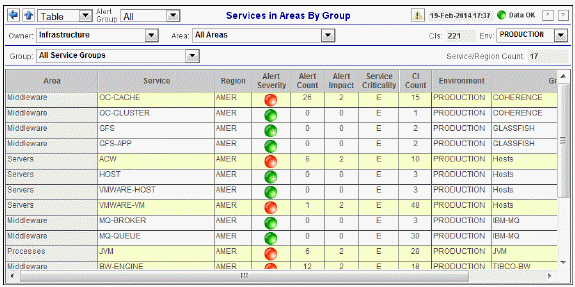
This table displays data shown in the Group/Service and Group/Region heatmaps. View Service metrics (Impact, Severity, Count and Criticality, and CI Count) for one or all Areas, Owners, Groups and Environments, and compare detailed metrics across all Areas in your organization. The table lists Services by Owner and Area. Each row in the table is a different Service. The color of the circle in the Alert Severity column represents the most critical alert state for that Service.
Use the available drop-down menus or right-click to filter data shown in the display. Click Sort ![]() to order column data. Drill-down and investigate by clicking a row in the table to view details in the last display that was viewed under either the Service Summary Views or Key Metric Views. For example, if the last selected display was the Service Summary display under Service Summary Views and you clicked on a row in the table, the details would display in the Service Summary display. If the last selected display was the Service KM Table display under Key Metrics Views, then clicking a row in the table displays the details in the Service KM Table.
to order column data. Drill-down and investigate by clicking a row in the table to view details in the last display that was viewed under either the Service Summary Views or Key Metric Views. For example, if the last selected display was the Service Summary display under Service Summary Views and you clicked on a row in the table, the details would display in the Service Summary display. If the last selected display was the Service KM Table display under Key Metrics Views, then clicking a row in the table displays the details in the Service KM Table.

|
Title Bar: Indicators and functionality might include the following: |
||||
|
|
|
|||
Note: The “Up” Arrow ( ) opens the most recently viewed display under All Management Areas. For example, if the last viewed display under All Management Areas was Area Table, then clicking
  opens the Area Table display.
|
Row Color Code: Tables with colored rows indicate the following: |
|
|
|
|
|
Filter By: The following filtering options are typically included: |
||||
|
|
Owner: Choose an Owner to see metrics for Areas associated with that Owner. Area: Choose an Area to see metrics for Groups associated with that Area and Owner. Group: Choose a Group to see metrics for Services associated with that Group, Area and Owner. Service: Choose a Service to see metrics for Environments associated with that Service, Group, Area and Owner. Env: Choose an Environment to see metrics for Environments associated with that Service, Group, Area and Owner. |
|||
|
Fields and Data This display includes: |
|||
|
|
Service/Region Count |
The total number of Services listed in the table. This value is determined by the selections made from display drop-down menus. |
|
|
|
Area |
The name of the Area where the alert data originated. |
|
|
|
Service |
The name of the Area where the alert data originated. |
|
|
|
Region |
The name of the Region to which the Service applies. |
|
|
|
Severity |
The maximum level of alerts in the row. Values range from 0 to 2, where 2 is the greatest Severity:
|
|
|
|
Alert Count |
The total number of critical and warning alerts for the Service. |
|
|
|
Alert Impact |
The maximum of the products of maximum Alert Severity multiplied by the Criticality of all CIs for the Service. Values range from 0 - 10, where 10 is the highest Alert Impact. |
|
|
|
Service Criticality |
The Criticality (rank of importance) specified in the Service Data Model (CMDB) by your administrator. Criticality values are listed in the Component Views / CI Service Table display, which range from A to E, where A is the highest Criticality. |
|
|
|
CI Count |
The total number of configurable items associated with the Area. |
|
|
|
Environment |
The name of the Environment to which the Service applies. |
|
|
|
Group |
The name of the Environment to which the Service applies. |
|
|
|
CI Count |
The name of the Group to which the Service applies. |
|