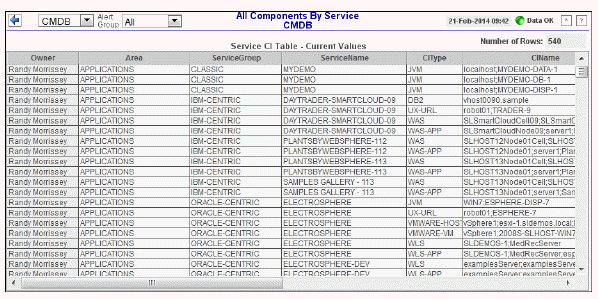
View the contents of the CMDB, without filtering, in a tabular format. Each row in the able is a different CI (for example, localhost;RTVMGR_DATASERVER).
Use the available drop-down menus or right-click to filter data shown in the display. Click Sort ![]() to order column data.
to order column data.

|
Title Bar: Indicators and functionality might include the following: |
||||
|
|
|
|||
|
Row Color Code: Tables with colored rows indicate the following: |
|
|
|
|
|
Filter By: The following filtering options are typically included: |
||||
|
|
Owner: Choose an Owner to see metrics for Areas associated with that Owner. Area: Choose an Area to see metrics for Groups associated with that Area and Owner. Group: Choose a Group to see metrics for Services associated with that Group, Area and Owner. Service: Choose a Service to see metrics for Environments associated with that Service, Group, Area and Owner. Env: Choose an Environment to see metrics for Environments associated with that Service, Group, Area and Owner. |
|||
|
Fields and Data This display includes: |
||||
|
|
Number of Rows |
The current total number of rows in the table. |
||
|
|
Service CI Table |
|
|
|
|
|
|
Owner |
The Owner the CI is associated with. |
|
|
|
|
Area |
The Area the CI is associated with. |
|
|
|
|
ServiceGroup |
The Group the CI is associated with. |
|
|
|
|
ServiceName |
The Service the CI is associated with. |
|
|
|
|
CIType |
The type of CI. |
|
|
|
|
CIName |
The name or address of the CI. |
|
|
|
|
Severity |
The maximum level of alerts for the CI. Values range from 0 to 2, where 2 is the greatest Alert Severity:
|
|
|
|
|
Criticality |
The Criticality (rank of importance) specified in the Service Data Model (CMDB) by your administrator. Criticality values are listed in the Component Views - CI Service Table display, which range from A to E, where A is the highest Criticality. This value is used to determine the value for Alert Impact. |
|
|
|
|
Environment |
The Environment for the CI. |
|
|
|
|
City |
The name of the City for the CI. |
|
|
|
|
Country |
The name of the Country for the CI. |
|
|
|
|
Region |
The name of the Region for the CI. |
|
|
|
|
SiteName |
The name of the Site for the CI. |
|