Using the Platform - Architecture
These displays provides
you a view of RTView EM component connectivity, mapping between component
types, and component level connection and performance information. The
Architecture displays are
provided with RTView EM.
Displays include:
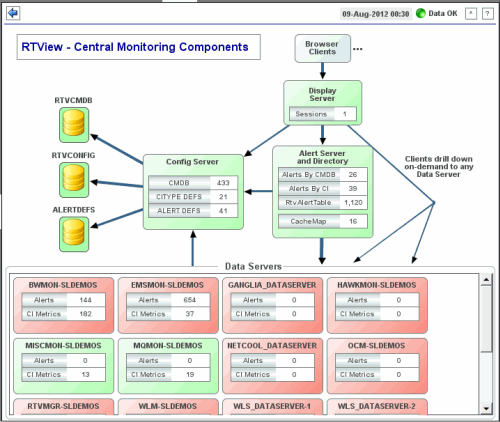
System Overview
View a topology map
of the central RTView EM monitoring components and their
current connection state. Each object represents a component which are color-coded to indicate
component status. Red indicates the component stopped running. Green indicates
the component is running.
| Date, Time |
The
current data and time. When the time is incorrect, this might indicate that RTView
stopped running. |
| Data OK |
The data connection state. When the Date, Time
field displays the correct time and the Data OK indicator is green, this is a strong indication
that the RTView EM platform is receiving current and valid data. |
| Red |
The data source is disconnected (for example, if the Data Server is not
receiving data, or if the Display Server does not receive data from the Data
Server, this will be red). |
| |
| Green |
The data
source is connected.
|
| |
|
Config Server |
The Configuration Server provides
configurations to all central
RTView EM components. |
|
CMDB |
The number of CIs
in the CMDB. |
|
CITYPE DEFS |
The current number
of CITYPE definitions. |
| ALERTDEFS |
The current number
of alert settings and override definitions. |
|
Alert Server and Directory |
The
Alert and Directory Server centralizes access to all alerts alerts sent
by remote Data Servers, and maintains a directory table of CI locations. The
CI location is the name of the source Data Server. |
|
Alerts By CMDB |
The number of Services in the CMDB that currently have at least one
associated alert. |
|
Alerts By CI |
The number of
CIs
in the CMDB that currently have at least one associated alert. |
|
RtvAlertTable |
The number of currently active alerts in the system. |
| CacheMap |
The number of entries currently in the directory table. |
|
Display Server |
The
Display Server generates HTML displays for browser clients. |
| Sessions |
The current number
of users connected to the Display Server. |
|
Browser Clients |
The
browser clients are represented in the topology as a single object. No data
is shown for browser clients. |
|
Data Servers |
This
panel in the topology shows all Data Servers. |
|
Alerts |
The number of
currently activated alerts for the Data Server. |
|
CI Metrics |
The count of CI metrics that the remote Data Server is sending. |
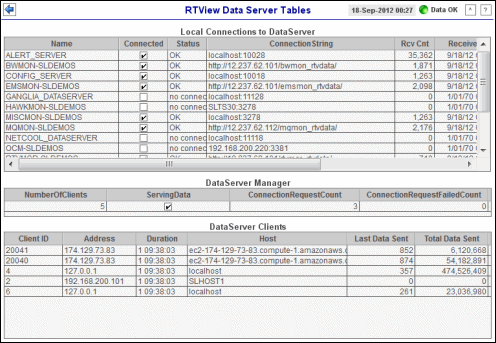
RTView Data Server Tables
View Data Server
connection status and detailed client connection information.
| Date, Time |
The
current data and time. When the time is incorrect, this might indicate that RTView
stopped running. |
| Data OK |
The data connection state. When the Date, Time
field displays the correct time and the Data OK indicator is green, this is a strong indication
that the RTView EM platform is receiving current and valid data. |
| Red |
The data source is disconnected (for example, if the Data Server is not
receiving data, or if the Display Server does not receive data from the Data
Server, this will be red). |
| |
| Green |
The data
source is connected.
|
| |
|
Local Connections to Data Server |
This
table lists all Data Servers and detailed connection information. Select a
Data Server to view further details (in the lower tables). |
| Name |
The Data Server
name. |
| Connected |
When checked, the
connection is currently connected. |
| Status |
The Data Server connection status. |
| Connection
String |
The host name and
port number for TCP connections, or the URL for servlet connections. |
| Rcv Cnt |
The number of data
updates received from that Data Server. |
| ReceiveTime |
The time that data was last received. |
| Config |
The RTView version
running on the Data Server. |
| |
|
Data Server Manager |
This
table shows connection information for the Data Server selected from the
Local Connections to Data Server
table. |
| NumberOf
Clients |
The number of
clients currently connected to the Data Server. |
| ServingData |
When checked, the
Data Server is currently serving data. |
| Connection
Request Count |
The number of
client requests to connect to the Data Server. |
| Connection
Request FailedCount |
The number of
client requests to connect to the Data Server that were unable to connect. |
| |
|
Data Server Clients |
This
table shows information for clients connected to the Data Server selected
from the Local Connections to Data
Server table. |
| ClientID |
A unique string
identifier for the client. |
| Address |
The client IP
address. |
| Duration |
The client session
length of time. |
| Host |
The address of the
client host. |
| Last Data Sent |
The amount of
data, in bytes, the Data Server last sent to the client. |
| Total Data Sent |
The total amount
of data, in bytes, the Data Server has sent to the client. |
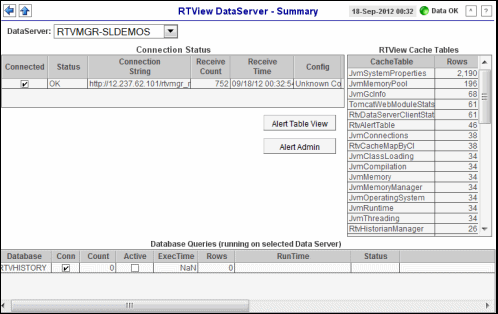
RTView Data Server Summary
View Data Server
connection status, Cache table sizes and database query metrics.
| Date, Time |
The
current data and time. When the time is incorrect, this might indicate that RTView
stopped running. |
| Data OK |
The data connection state. When the Date, Time
field displays the correct time and the Data OK indicator is green, this is a strong indication
that the RTView EM platform is receiving current and valid data. |
| Red |
The data source is disconnected (for example, if the Data Server is not
receiving data, or if the Display Server does not receive data from the Data
Server, this will be red). |
| |
| Green |
The data
source is connected.
|
| |
|
Data Server |
Select a Data Server from the
drop-down menu to view details for in the display. |
| |
|
Connection Status |
This
table shows connection details for the selected
Data Server. |
| Connected |
When checked, the
Data Server is currently connected. |
| Status |
The Data Server
connection status. |
| Connection
String |
The host name and
port number for TCP connections, or the URL for servlet connections. |
| Rcv Cnt |
The number of data
updates received from that Data Server. |
| ReceiveTime |
The time that data was last received. |
| Config |
The RTView version
running on the Data Server. |
| Alert Table View |
Select to view or manage current
alerts for the selected Data Server in the
Alerts Table display. |
| Alert Admin |
Select to view or manage alert
thresholds for the selected Data Server in the
Alerts Administration display. |
| |
|
RTView Cache Tables |
This
table lists Cache Tables and their size, in number of rows, for the selected
Data Server. Select a Cache Table to view details in the RTView Cache
Tables display.
Use this data for debugging. This display
is typically used for troubleshooting with SL Technical Support. |
| CacheTable |
The name of the Cache Table. |
| Rows |
The current number of rows in the Cache Table. |
| |
|
Database Queries |
This
table lists the databases and query details for the selected Data
Server. Each table row describes a different query. |
| Database |
The name of the
database. |
| Conn |
When checked, the
database is currently connected. |
| Count |
The number of
query requests from current Data Server. |
| Active |
When checked, the query is currently running. |
| ExecTime |
The amount of
time, in milliseconds, to execute the query. |
| Rows |
The number of
rows the query created. |
| RunTime |
The time the query
was executed. |
| Status |
The latest result
status of the query. |
| Query |
The query that was
executed. |
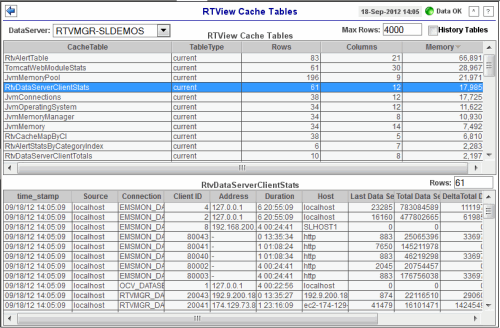
RTView Cache Tables
View Data Server Cache table
sizes and contents.
| Date, Time |
The
current data and time. When the time is incorrect, this might indicate that RTView
stopped running. |
| Data OK |
The data connection state. When the Date, Time
field displays the correct time and the Data OK indicator is green, this is a strong indication
that the RTView EM platform is receiving current and valid data. |
| Red |
The data source is disconnected (for example, if the Data Server is not
receiving data, or if the Display Server does not receive data from the Data
Server, this will be red). |
| |
| Green |
The data
source is connected.
|
| |
|
Data Server |
Select a Data Server from the
drop-down menu to view details for in the display. |
| Max Rows |
Enter the maximum number of rows to include in
the lower table, then click Enter. |
| History Tables |
Select
to include
all defined
history tables in the
RTView Cache Tables
list. |
| |
|
RTView Cache Tables |
This
table lists cache tables for the selected
Data Server. Select a cache table to view details in the lower table. |
|
CacheTable |
The
name of the cache table. |
|
TableType |
The
type of cache table. |
|
current |
This table is a
current table which
shows the
current values for each index. |
|
current_condensed |
This table is a
current table with primary compaction configured. |
| history |
This table is a
history table. |
| history_condensed |
This table is a
history table with primary compaction configured.
|
| history_combo |
This table is a
history table with primary compaction configured, and which is also
configured to store rows of recent raw data followed by rows of older
condensed data. |
|
Rows |
The number of rows
currently in the table. |
|
Columns |
The number of
columns currently in the table. |
|
Memory |
The amount of
space, in bytes, used by the table. |
| |
|
(Table) |
This
table shows the actual contents of the selected cache table. Available
columns vary by cache. For example, a JVM cache table might provide
BootClassPath and InputArgument columns, and a Tomcat cache might
provide RateAccess and cacheMaxSize columns. |
| Rows |
The number of rows
currently in the table. |
RTView CI Stats Tables
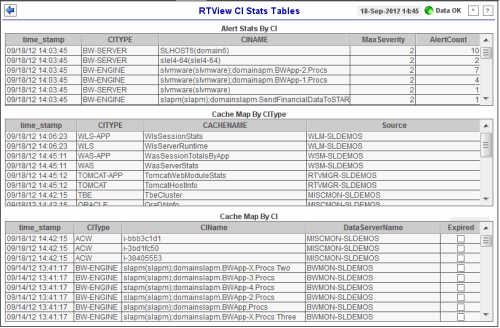
View details for
components that currently have an active warning or alarm alert.
| Date, Time |
The
current data and time. When the time is incorrect, this might indicate that RTView
stopped running. |
| Data OK |
The data connection state. When the Date, Time
field displays the correct time and the Data OK indicator is green, this is a strong indication
that the RTView EM platform is receiving current and valid data. |
| Red |
The data source is disconnected (for example, if the Data Server is not
receiving data, or if the Display Server does not receive data from the Data
Server, this will be red). |
| |
| Green |
The data
source is connected.
|
| |
|
Alert Stats By CI |
This
table provides summary alert details for all CIs
that currently have active warning or alarm alerts. |
| time_stamp |
The date and time
this table row of
data was last updated.
Format: MM/DD/YY
HH:MM:SS <month>/ <day>/<year> <hours>:<minutes>:<seconds> |
| CIType |
The
component type. |
| CIName |
The name of the
component. |
| MaxSeverity |
The most critical
alert state of all current alerts for this component. |
| AlertCount |
The number of
current warning and alarm alerts for this component. |
| |
|
Cache Map By CIType |
This
table provides mapping of all component types to caches. |
| time_stamp |
The date and time
this table row of
data was last updated.
Format: MM/DD/YY
HH:MM:SS <month>/ <day>/<year> <hours>:<minutes>:<seconds> |
| CIType |
The
component type. |
| CACHENAME |
The name of the
cache associated with the component type. |
| Source |
The name of the Data Server
alert sending data for that component type. |
| |
|
Cache Map By CI |
This
table provides the location of all CIs. |
| time_stamp |
The date and time
this table row of
data was last updated.
Format: MM/DD/YY
HH:MM:SS <month>/ <day>/<year> <hours>:<minutes>:<seconds> |
| CIType |
The
component type. |
| CIName |
The name of the
component. |
| DataServerName |
The name of the
Data Server which sent this CI. |
| Expired |
When checked, data has not been received for 45
seconds. After 3600 seconds it is deleted from
the table. |
RTView CI Type Defs
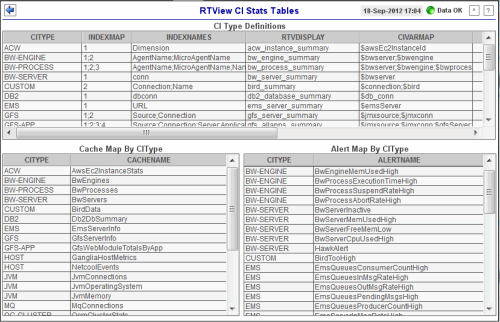
This display provides component type
definitions and shows the mapping of component types to caches as well as component types
to alerts.
| Date, Time |
The
current data and time. When the time is incorrect, this might indicate that RTView
stopped running. |
| Data OK |
The data connection state. When the Date, Time
field displays the correct time and the Data OK indicator is green, this is a strong indication
that the RTView EM platform is receiving current and valid data. |
| Red |
The data source is disconnected (for example, if the Data Server is not
receiving data, or if the Display Server does not receive data from the Data
Server, this will be red). |
| |
| Green |
The data
source is connected.
|
| |
|
CI Type Definitions |
This
table provides definitions for all CI Types. |
| CIType |
The
component type. |
| INDEXMAP |
Number of indices
and the order in which they are used to form the CI Name. |
| INDEXNAMES |
Semicolon-separated list of the index columns. |
| RTVDISPLAY |
The name of the
RTView display to drill-down to from the Alerts Table to see summary
data for this CI Type. This is the target of the Go To CI button in
the Alerts Table and in the Service Summary display. |
| CIVARMAP |
The names of
substitutions that must be set to drill-down to the display. |
| DEFAULTQUALITY |
A flag indicating
whether the lack of data is considered an error condition or not. |
| OWNER |
The Owner the CIType is associated with, when the CMDB is
populated automatically from CIs of this type. |
| AREA |
The Area
the CIType is associated with. |
| SERVICEGROUP |
The SERVICEGROUP
the CIType is associated with, when the
CMDB is populated automatically from CIs of this type. |
| |
|
Cache Map By CIType |
This
table provides mapping of component types to caches for all component types. |
| CIType |
The
type of CI. |
| CACHENAME |
The name of the
cache associated with the component type. |
| |
|
Alert Map By CIType |
This
table provides mapping of component types to alerts. |
| CIType |
The
type of CI. |
| ALERTNAME |
The name of the
alert. |
|

