Though similar, there are two slightly different flows for configuring the TIBCO Spotfire reports:
-
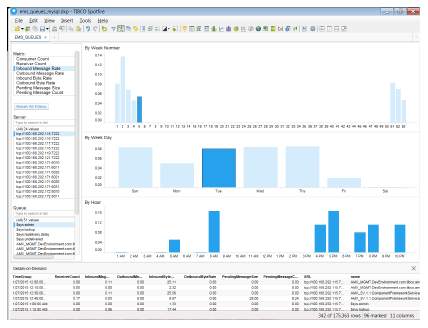
Open the ems_queues_mysql.dxp Spotfire Analysis file in the rtvapm/emsmon/projects/reports/Spotfire directory that was created during the EMS Monitor installation.
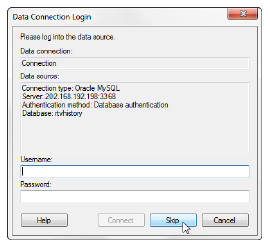
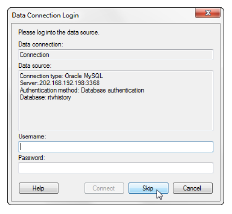
The Data Connection Login window displays.
-
Click the Skip button (there is no need to log in at this point).
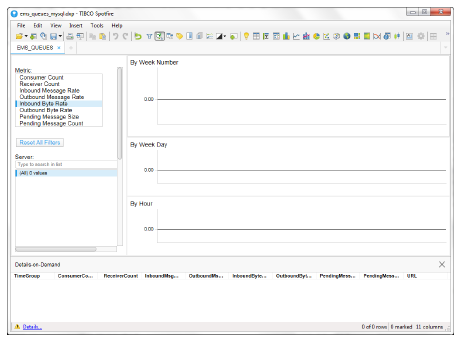
The TIBCO Spotfire dashboard displays.
-
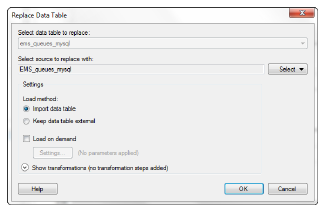
Click File> Replace Data Table.
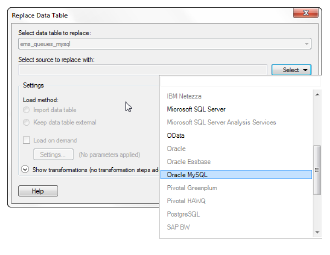
The Replace Data Table window displays.
Note: When connecting the ems_queues_mysql dashboard to your MySQL data, Spotfire’s Replace Data Table functionality may run very slowly, or even time-out, if the dataset is too large.
-
Click the Select button (associated with the Select source to replace with field) and select Oracle MySQL.
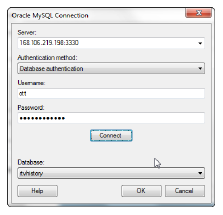
The Oracle MySQL Connection window displays.
-
Enter the Server, Username, Password, select Database authentication as the Authentication Method, and click the Connect button.
The Database drop down should be populated.
-
Select rtvhistory from the Database drop down and click the OK button.
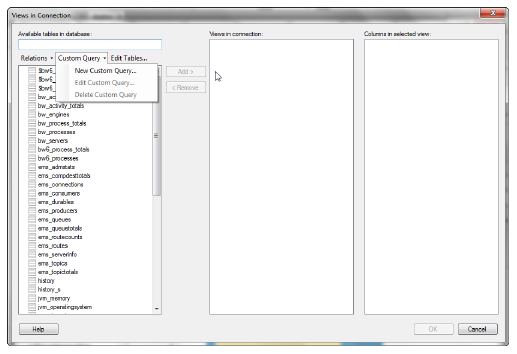
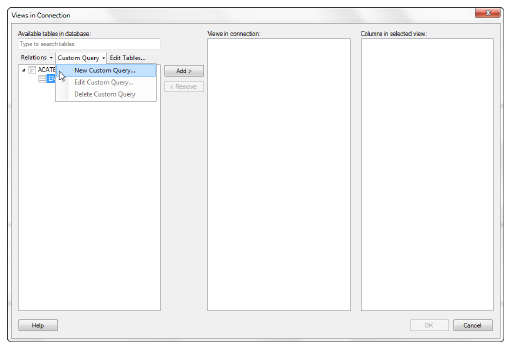
The Views in Connection window displays.
-
Select the Custom Query drop down list and select New Custom Query.
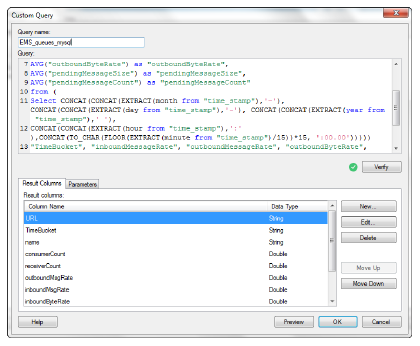
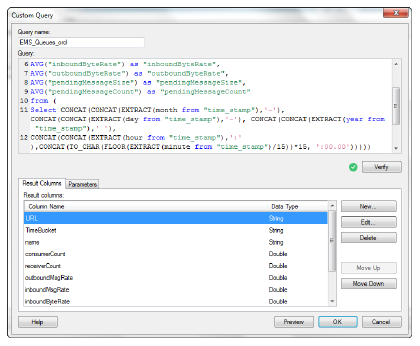
The Custom Query window displays.
-
Enter the desired name (whatever name is meaningful for you) into the Query_name field, open the text file in your installation directory associated with your table (for example, if you are selected ems_queues_mysql.dxp initially, then open ems_queues_mysql.txt), copy and paste the SQL code in the file into the Query field on the Custom Query window, and click the Verify button.
Note: This step is required because the database contains data that has been compacted as well as data that has not yet been compacted. The SQL code compacts the data that has not been compacted and adds the newly compacted data to the already compacted data so that all the “bucket” values are the same. For example, let’s say the compacted data is compacted so that the oldest data is contained in 15 minute buckets, but the more recent data is contained in 5 or 10 minute buckets. The SQL code takes the data contained in the 5 and 10 minute buckets and compacts it into 15 minute buckets so that all the data is consistently bucketed.
Once the SQL has been verified, the column names display in the Result Columns tab.
-
Click the OK button on the Custom Query window.
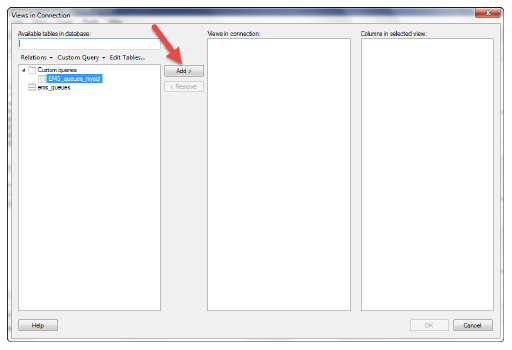
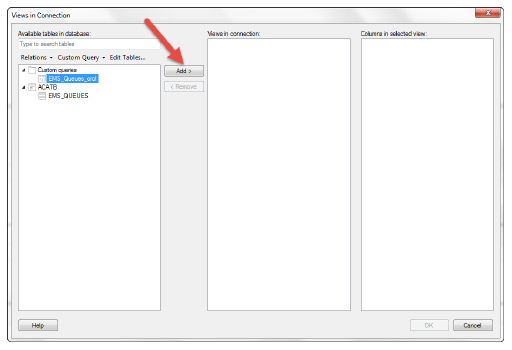
The new query (for example, EMS_queues_mysql) should display in the list of Custom queries on the Views in Connection window.
-
Select your new custom query and click the Add button.
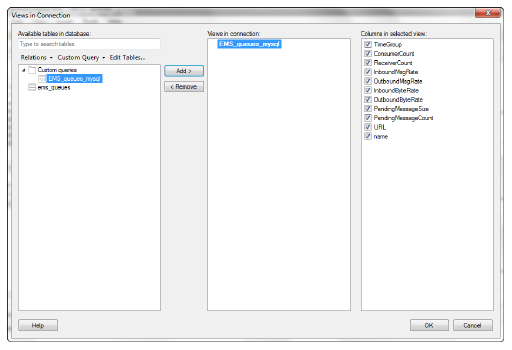
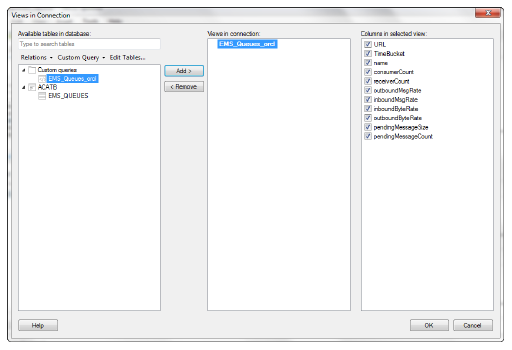
Your new custom query should display in the Views in connection region and the query’s associated columns should display in the Columns in selected view region.
-
Click the OK button on the Views in Connection window.
The Replace Data Table window displays.
-
Select the Import data table radio button and click the OK button.
Your data should display in TIBCO Spotfire.
-
Repeat the same steps above for the ems_serverinfo_mysql.dxp Spotfire Analysis file and the ems_serverinfo_mysql.txt file to create the EMS Server Message Metrics Report.
-
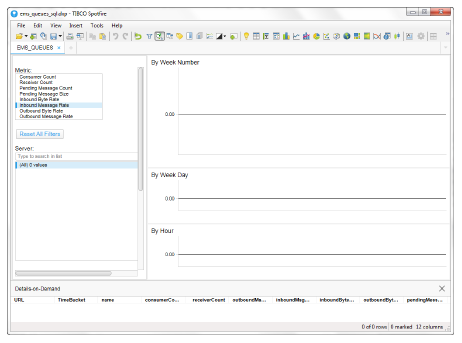
Open the ems_queues_sql.dxp Spotfire Analysis file in the rtvapm/emsmon/projects/reports/Spotfire directory that was created during the EMS Monitor installation.
The Data Connection Login window displays.
-
Click the Skip button (there is no need to log in at this point).
The TIBCO Spotfire dashboard displays.
-
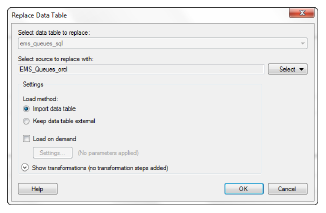
Click File> Replace Data Table.
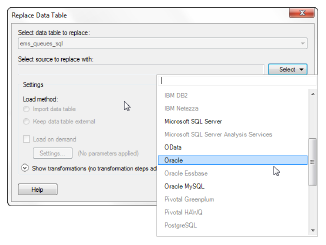
The Replace Data Table window displays.
-
Click the Select button (associated with the Select source to replace with field) and select Oracle.
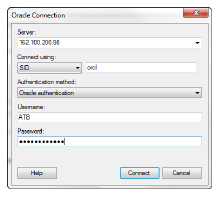
The Oracle Connection window displays.
-
Enter the Server, select SID in the Connect using drop down (and enter orcl in the associated field if not defaulted), select Oracle authentication as the Authentication Method, enter the Username and Password, and click the Connect button.
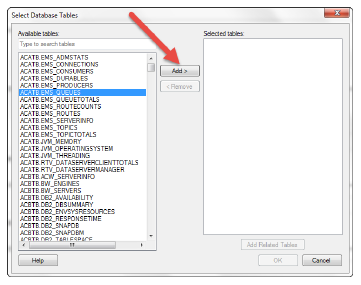
The Select Database Tables window displays.
-
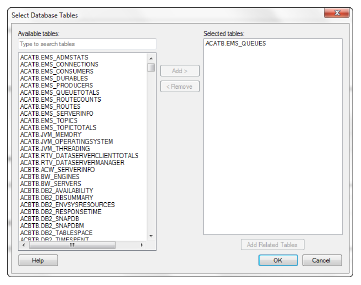
Select ACATB.EMS_QUEUES from the Available Tables select list and click the Add button.
The table displays in the Selected tables region.
-
Click the OK button.
The Views in Connection window displays with the selected table listed in the Available tables in the database region.
-
Select the EMS_QUEUES table from the list and click Custom Query > New Query.
The Custom Query window displays.
-
Enter the desired name (whatever name is meaningful for you) into the Query_name field, open the text file in your installation directory associated with your table (for example, if you selected ems_queues_sql.dxp initially, then open ems_queues_sql.txt), copy and paste the SQL code in the file into the Query field on the Custom Query window, and click the Verify button.
Note: This step is required because the database contains data that has been compacted as well as data that has not yet been compacted. The SQL code compacts the data that has not been compacted and adds the newly compacted data to the already compacted data so that all the “bucket” values are the same. For example, let’s say the compacted data is compacted so that the oldest data is contained in 15 minute buckets, but the more recent data is contained in 5 or 10 minute buckets. The SQL code takes the data contained in the 5 and 10 minute buckets and compacts it into 15 minute buckets so that all the data is consistently bucketed.
Once the SQL script has been verified, the column names display in the Result Columns tab.
-
Click the OK button.
The new query displays under Custom queries in the Available tables in database list on the Views in Connection window.
-
Select your newly added query/view and click the Add button.
The new query displays in the Views in connection list and the associated columns display in the Columns in selected view region.
-
Click the OK button.
The Replace Data Table window displays.
-
Select Import data table as the Load Method and click OK.
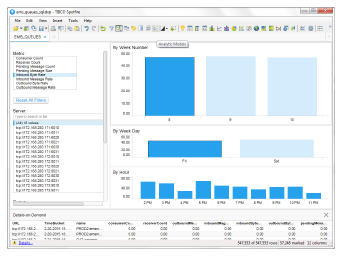
Your report should display in the TIBCO Spotfire dashboard.
-
Repeat the above steps using the ems_serverinfo_sql.dxp Spotfire Analysis file and the ems_serverinfo_sql.txt files to create the EMS Server Message Metrics Report.